The Monday Morning Quarterback
ELLIOTT D. POLLACK & Company
A quick analysis of important economic data released over the last week
Despite a nerve-racking week for the stock market, the economic data looks pretty good. As economist Paul Samuelson said, “The stock market has predicted 9 of the last 5 recessions.”
Most economic data is still positive. It would take a major shock to throw things off track at this point in the cycle. While events in China will likely slow grow modestly in late 2015 and 2016, the rate of growth should look very much like what we have become used to over the this recovery/expansion.
The good news this week included upward revisions in 2nd quarter real GDP, stability in corporate profits, continued growth in real income and better than expected results in consumer confidence.
U.S. Snapshot:
- Revised 2nd quarter real GDP indicate that there was a big bounce after all. The revised rate of growth in the quarter was 3.7%, up from the initial estimate of 2.3%. Consumer demand was strong. It was led by an 8.2% rate of growth in durables, a gain tied to vehicle sales. Residential investment was also strong. The acceleration is now much more respectable after a weak 1st quarter (0.6%).
- Corporate net cash flow remained strong in the 2nd quarter. Net cash flows were down 0.6% from a year ago, but, were up 1.2% from a weaker 1st quarter.
- Exports have been weak but they didn’t hold down July’s durable orders which were respectable for the second straight month. New orders rose 2.0% in the month. This was above expectations. It also indicates that despite a weak 1st half, lately, domestic strength has helped offset ongoing concerns over the strong dollar.
- Personal income as of July stands 4.3% above a year ago and increased at a 4.8% annual rate for the month. Disposable income stood 3.6% above a year ago and grew at close to 6.0% at an annual rate in July. Both grew more rapidly than inflation so real incomes rose. Also, since personal consumption expenditures grow less rapidly than disposable incomes, the saving rate increased. It is now 4.9%, up from 4.8% in June.
- Significant improvement in the assessment of the current labor market drove the Conference Board’s consumer confidence index up beyond expectations. The index was 101.5 in August, up from 91.0 in July. On the other hand, the University of Michigan consumer sentiment reading was downbeat. The final August reading was 91.9 compared to 93.1 in July. The result of these two is probably a wash.
- New home sales rose solidly in July after weakness in June. Year over year, sales were up 25.8%. Compared to June, sales were up 5.4%.
Arizona Snapshot:
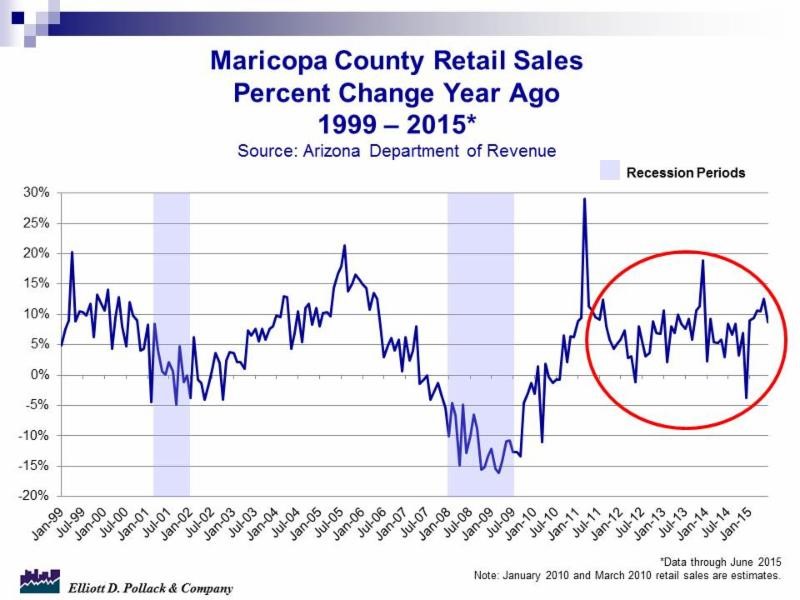
- Through June, retail sales were up 7.1% for the state and 8.5% for Maricopa County (see chart below).
- Statewide lodging occupancy continued to improve in July. Occupancy rates were 59.3% compared to 56.6% a year ago. Demand was up 4.6% while supply was down 0.1% over that time period.
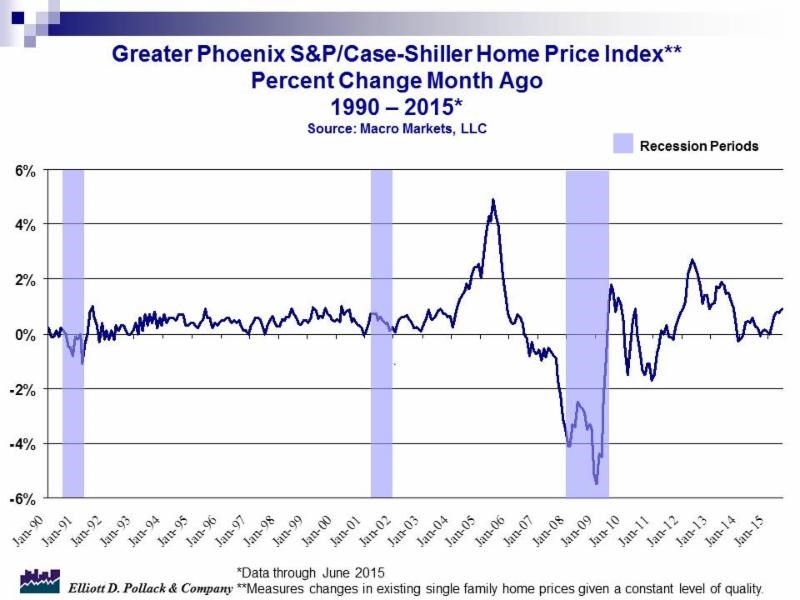
- The Greater Phoenix S&P/Case-Shiller home price index rose 0.9% in June and now stands 4.1% above a year earlier (see chart below).