 (Editor’s note: News releases are published unedited, unless they contain factual errors.)
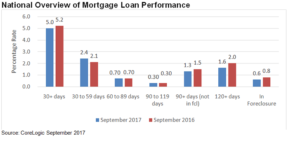
Overall Mortgage Delinquency Rate Fell 0.2 Percentage Points Year Over Year
Foreclosure Rate Declined 0.2 Percentage Points Year Over Year
Early-Stage Delinquencies Rose 0.3 Percentage Points Year Over Year
IRVINE, Calif., December 12, 2017 – CoreLogic® (NYSE: CLGX), a leading global property information, analytics and data-enabled solutions provider, today released its monthly Loan Performance Insights Report which shows that, nationally, 5 percent of mortgages were in some stage of delinquency (30 days or more past due including those in foreclosure) in September 2017. This represents a 0.2 percentage point year-over-year decline in the overall delinquency rate compared with September 2016 when it was 5.2 percent.
As of September 2017, the foreclosure inventory rate, which measures the share of mortgages in some stage of the foreclosure process, was 0.6 percent, down from 0.8 percent in September 2016. Both August and September of this year experienced the lowest foreclosure inventory rate since June 2007 when it was also 0.6 percent, and the September foreclosure inventory rate was the lowest for the month of September in 11 years when it was 0.5 percent in September 2006.
In Phoenix-Mesa-Scottsdale, 3.0 percent of mortgages were delinquent by at least 30 days (including those in foreclosure) in September 2017 compared with 3.2 percent in September 2016, representing a decrease of 0.2 percentage points*. Phoenix-Mesa-Scottsdale mortgages in serious delinquency (90+ days past due) totaled 0.8 percent in September 2017 compared with 1.0 percent in September 2016. The foreclosure inventory rate for this September was 0.2 percent compared with 0.2 percent a year earlier.
Measuring early-stage delinquency rates is important for analyzing the health of the mortgage market. To monitor mortgage performance comprehensively, CoreLogic examines all stages of delinquency as well as transition rates, which indicate the percentage of mortgages moving from one stage of delinquency to the next.
The rate for early-stage delinquencies, defined as 30-59 days past due, was 2.4 percent in September 2017, up 0.3 percentage points from 2.1 percent in September 2016. The share of mortgages that were 60-89 days past due in September 2017 was 0.7 percent, unchanged from September 2016. The serious delinquency rate, those that are 90 days or more past due, declined 0.4 percentage points year over year from 2.3 percent in September 2016 to 1.9 percent in September 2017. The 1.9 percent serious delinquency rate in June, July, August and September of this year marks the lowest level for any month since October 2007 when it was also 1.9 percent, and is also the lowest for the month of September since 2007 when the serious delinquency rate was 1.8 percent.
“September’s early-stage delinquency rate increased by 0.3 percent from a year ago, the largest increase since June 2009. This does not reflect a deterioration in credit, but rather the impact of the hurricanes in Texas, Florida and Puerto Rico,” said Dr. Frank Nothaft, chief economist for CoreLogic. “September’s early-stage delinquency transition rate rose to 2.6 percent in Texas and it rose to 3.2 percent in Florida, which is higher than the 1 percent that’s typical for both states. Texas and Florida’s early-stage delinquency transition rates in September are much lower than New Orleans in September 2005 when the transition rate reached 17.4 percent as a result of Hurricane Katrina.”
Since early-stage delinquencies can be volatile, CoreLogic also analyzes transition rates. The share of mortgages that transitioned from current to 30 days past due was 1.3 percent in September 2017, up from 0.9 percent in September 2016. The September rate was the highest for any month in nearly three years, since November 2014 when it was 1.4 percent. By comparison, in January 2007, just before the start of the financial crisis, the current-to-30-day transition rate was 1.2 percent and it peaked in November 2008 at 2 percent.
“While natural hazard risk was elevated in 2017, the economic fundamentals that drive mortgage credit performance are the best in two decades,” said Frank Martell, president and CEO of CoreLogic. “The combination of strong job growth, low unemployment rates, steady economic performance and prudent underwriting has led to continued improvement in mortgage performance heading into next year.”
*Percentage point differences may be affected by rounding.
Foreclosure and Delinquency Rates by State:
Source: CoreLogic September 2017 Foreclosure and Delinquency Rates for Select Core Based Statistical Areas (CBSAs):
|
| Source: CoreLogic September 2017 |
For ongoing housing trends and data, visit the CoreLogic Insights Blog: www.corelogic.com/blog.Source: CoreLogic September 2017
Methodology
The data in this report represents foreclosure and delinquency activity reported through September 2017.
The data in this report accounts for only first liens against a property and does not include secondary liens. The delinquency, transition and foreclosure rates are measured only against homes that have an outstanding mortgage. Homes without mortgage liens are not typically subject to foreclosure and are, therefore, excluded from the analysis. Approximately one-third of homes nationally are owned outright and do not have a mortgage. CoreLogic has approximately 85 percent coverage of U.S. foreclosure data.
Source: CoreLogic
The data provided is for use only by the primary recipient or the primary recipient’s publication or broadcast. This data may not be re-sold, republished or licensed to any other source, including publications and sources owned by the primary recipient’s parent company without prior written permission from CoreLogic. Any CoreLogic data used for publication or broadcast, in whole or in part, must be sourced as coming from CoreLogic, a data and analytics company. For use with broadcast or web content, the citation must directly accompany first reference of the data. If the data is illustrated with maps, charts, graphs or other visual elements, the CoreLogic logo must be included on screen or website. For questions, analysis or interpretation of the data, contact Lori Guyton at lguyton@cvic.com or Bill Campbell at bill@campbelllewis.com. Data provided may not be modified without the prior written permissio n of CoreLogic. Do not use the data in any unlawful manner. This data is compiled from public records, contributory databases and proprietary analytics, and its accuracy is dependent upon these sources.
About CoreLogic
CoreLogic (NYSE: CLGX) is a leading global property information, analytics and data-enabled solutions provider. The company’s combined data from public, contributory and proprietary sources includes over 4.5 billion records spanning more than 50 years, providing detailed coverage of property, mortgages and other encumbrances, consumer credit, tenancy, location, hazard risk and related performance information. The markets CoreLogic serves include real estate and mortgage finance, insurance, capital markets, and the public sector. CoreLogic delivers value to clients through unique data, analytics, workflow technology, advisory and managed services. Clients rely on CoreLogic to help identify and manage growth opportunities, improve performance and mitigate risk. Headquartered in Irvine, Calif., CoreLogic operates in North America, Western Europe and Asia Pacific. For more information, please visit www.corelogic.com.
CORELOGIC and the CoreLogic logo are trademarks of CoreLogic, Inc. and/or its subsidiaries.