The Monday Morning Quarterback | A quick analysis of important economic data released over the past week
By Elliott D. Pollack & Co.
The most important piece of economic information last week was not in the data. It was the failure of the ship of fools on both sides to deal with the sequestration. We now face a series of cuts that, in the aggregate, are not very intimidating. They amount to about 2.2% of the budget. But, they are centered in the non-entitlement part of the budget. Entitlements take about 63% (up from 52.8% in 1992 but lower than the 67.5% projected for 2017) of the budget. Interest on the debt takes another 6%. That leaves defense and everything else to absorb the blow. Even that would not be such a big deal except for two things. First, in a weak economy it would make more sense to phase in the reductions (in the aggregate, there are no cuts) so as to ease the pain. Two, politicians have a tendency to make the pain dramatic. It’s like when the Mayor of a city is trying to pass a new tax through the voters. In such a case, they always threaten cut backs in fire and police and not nonessential services.
The reality is that even the current administration can’t seriously think they can tax their way out of this one. First, recent studies show that the “rich” are paying a higher percent of their income in taxes than at any time since the government started keeping records on the subject in 1979. The rest of us, incidentally, are paying less than ever. Second, no plan to deal with the deficit and debt can be taken seriously if it doesn’t address Social Security and Medicare. In 1934, the life expectancy of someone entering the labor force was 66. Today, it is 79. The retirement age has increased only 2 years over that period. Given the 70+ million baby boomers set to retire over the next few years, the math doesn’t work. Same with Medicare. The chart below shows U.S. spending on health care by age compared to several other industrialized nations. Up until 56, we are about the same. After that, our costs go ballistic and others don’t. Herbert Stein, the chairman of the Council of Economic Advisors under Nixon, once said that if something can’t continue, it eventually won’t. We are approaching eventually. No one knows with certainty what the impact of sequestration will be. But, it will not be positive.
Continued below graph
 Arizona Snapshot:
Arizona continues to do better than the U.S. as a whole. Total claims for unemployment insurance continue to fall. Lodging numbers showed improvement. Housing remains a positive.
U.S. Snapshot:
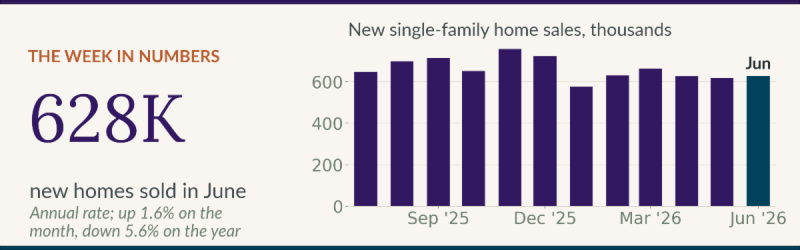
Consumer confidence improved as did personal consumption expenditures. Yet, savings rates fell indicating that the growth in expenditures can’t last. Manufacturing continued to show growth albeit modest. Vehicle sales were mixed, as was construction. New home sales were a plus.
Arizona
Arizona weekly unemployment claims were down by 1,800 and now stand 40.4% lower than a year ago. The national decline was down by single digits. Both statewide and Greater Phoenix lodging performance improved in January. Occupancy increased to 61.1% in Phoenix compared to 58.6% last year. Demand was up almost 5% while supply was up less than 1%.
Housing continues to do well. The lack of supply is allowing prices to continue to increase. The supply of speculative homes in Greater Phoenix is a mere 995. MLS has 10% fewer homes listed than it did a year ago. Existing prices are up 30% year over year. According to Jim Belfiore, same-store new build prices rose 10.2% last year. Builders have increased the number of storefronts from 315 last month to 326 this month. This is still way too low. Also, Jim projects that 62% of the active subdivisions will be sold out in the next 12 months.
National
Revised fourth quarter real GDP now shows that the economy grew between Q3 and Q4 by 0.1%. Previous data showed a decline of 0.1%. Hardly a difference. Personal income fell as expected in January due to fiscal cliff effects, but, it fell more than expected. Spending, though, held up. Despite declines in total and disposable personal income, personal consumption expenditures increased. As a result the U.S. personal savings rate dropped from 6.4% to 2.4%. The savings rate averaged roughly 3.4% for the 12 month period prior to December. It is likely that the increase in payroll taxes forced consumers into using their savings in order to maintain consumption. That behavior is likely to prove transitory.
Both measures of consumer confidence were up in February. The University of Michigan sentiment index increased from 73.8 to 77.6. The Conference Board index increased from 58.6 to 69.6. Also, The Institute for Supply Management index indicates that the overall economy grew for the 45th consecutive month and that the manufacturing sector is still growing.
Motor vehicle sales were down slightly from December but remain more than 9% above year earlier levels. The same trend is true for construction spending in the U.S. It was down 2.1% from last month but up 7.15% above year earlier levels. New home sales in January stood 28.9% above a year ago, and according to the S&P/Case-Shiller home price index, home prices nationally were up 7.3% in 2012.