The Monday Morning Quarterback : A quick analysis of important economic data released over the last week
Arizona Snapshot
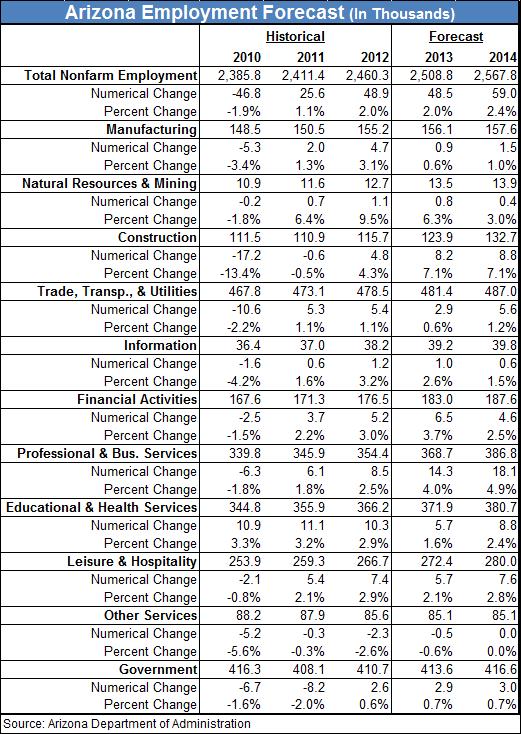
The latest forecasts from the Arizona Department of Administration projected the state to gain 107,500 nonfarm jobs between 2012 and 2014. That is a two-year period. All sectors are projected to gain jobs. The chart below indicates the percent change anticipated and the absolute growth in jobs projected.
Arizona retail sales continue to do well in total. They now stand 9.9% above a year ago. Yet, the major increases in terms of dollars and percent change remain in the Motor Vehicle Dealers and Miscellaneous Automotive categories. Other categories are increasing, but, not as rapidly.
Greater Phoenix single-family listings on the multiple listing service are up 16.0% over a year ago. That has pushed up month’s supply of houses on the market to 4.4 vs. 3.2 a year ago.
The new supply has caused the median price of sales in the MLS to flatten in October to $185,000, the same as in September. In total, resale activity in October was 10.6% below a year ago.
New build sales volume was 7.4% below a year ago. Median new home prices were $300,522 compared to $246,037 a year ago and $294,012 in September.
Foreclosure activity in the Valley continues to decline and is now at levels not seen since 2006.
U.S. Snapshot
Job growth topped expectations. Total payroll jobs in October increased 204,000 following a revised increase of 163,000 for September. August was also revised upward from 193,000 to 238,000. Given the revisions, the employment picture has been stronger than generally recognized. The consensus for October was for an increase of 120,000. Yet, the unemployment rate firmed to 7.3% in October. This was the consensus forecast.
Real GDP for the third quarter was also a surprise on the high side. But, inventories played a big role. Analysts had projected a 2.0% rise. The major difference between the projected and the actual was a large increase in inventories that contributed 0.83 percentage points to the growth in real GDP between the second and third quarters. Overall, the economy is not as strong as the headline number suggests.
National personal income increased in September by 3.7% vs. a year ago and 0.5% from a month ago. Disposable personal income grew by 2.9% and 0.5% over the same time periods. Personal consumption expenditures grew at a slightly slower pace than DPI (2.7% and 0.2% respectively). Thus, the savings rate increased slightly from 4.7% in August to 4.9% in September.
The index of leading indicators increased 0.7% in September. This follows a 0.7% gain in August and a 0.4% gain in July.
According to the University of Michigan, consumer sentiment unexpectedly dipped in November to a two-year low as lower income households worried about their job prospects and financial outlooks and negative views of the government lingered. The index stands at 72.0 compared to 73.2 last month and 82.7 a year ago.
The government’s acquisition of student loans is once again inflating gains for consumer credit, which rose $13.7 billion (0.5%) in September. The latest gain, like past gains in this cycle, is entirely in the non-revolving component. Revolving credit, the component where credit card debt is tracked, is down 0.2%. Retailers are increasingly concerned that spending will be limited during the holidays which don’t look like they will get much of a boost from consumer borrowing.
Increases in the median existing home price have slowed. The National Association of Realtors indicated that the median price of an existing home was $207,300 in the third quarter compared to $203,400 in the second quarter. In Greater Phoenix, the NAR data shows third quarter median prices at $191,700 compared to $183,300 in the second quarter.


