 The Monday Morning Quarterback, a quick analysis of important economic data released over the past week | Elliott D. Pollack & Company
As expected, the mostly good news reported last week reflects recovery from the economic weakness of the first quarter due to weather and port slowdown. Employment growth was at the top of the forecast range. Real hourly wages are increasing. And while the unemployment rate increased modestly, it was due to an increase in the labor force participation rate. This is a healthy sign.
Listening to the news, any good news can be given a negative spin. In this case, it’s that the healthier economy will lead to higher interest rates by the Fed. Surprise!!! This isn’t necessarily a bad thing. Market rates have already gone up. But, they are at such a low level that the increase isn’t having much of an effect. Yes, mortgage rates are higher. But, by historic standards, they remain low. In addition, having rates at a higher level gives the Fed some wiggle room if and when the economy hits a bump. So, relax.
U.S. Snapshot:
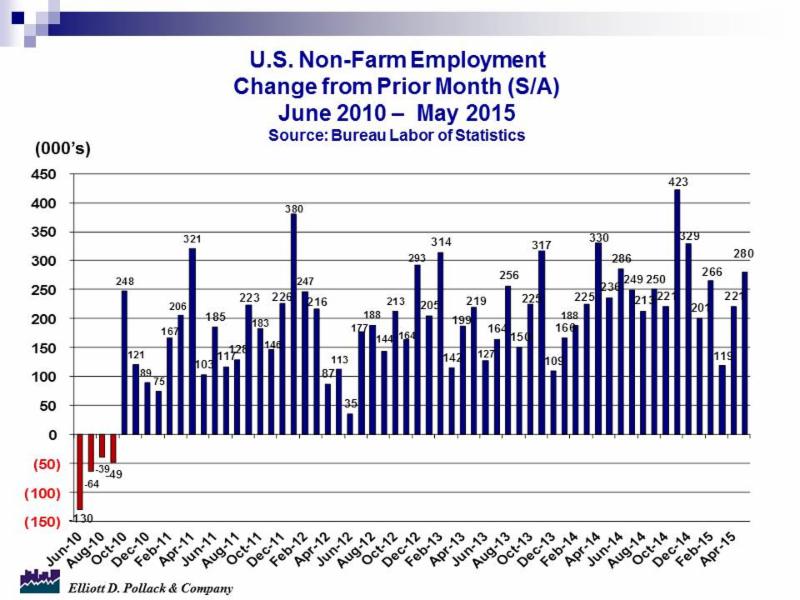
Nonfarm payrolls rose 280,000 last month (see chart below). This is well above the consensus of 220,000. In addition, March and April data was revised upward by a total of 32,000 jobs. Professional and Business Services lead the pack, up 63,000 jobs. Trade, Transportation, and Utilities was up 50,000. Retail was up a solid 31,000 and Construction was up 17,000. Manufacturing, where exports are hurting, was up by only 7,000. And mining, where energy jobs are counted, was down 17,000.
Average hourly earnings came in at the high end of expectations at 0.3% (a 3.6% annual rate). Year over year, earnings are up 2.3%. This is higher than the rate of inflation over that period.
The labor force participation rate was up by 0.1%. While this is small, at least it’s up. This indicates that discouraged workers may at long last be reentering the labor force. This is good for the economy as a whole and will lower pressure that a continued decline in the unemployment rate might cause.
The unemployment rate did tick up 0.1% to 5.5%. Although this was unexpected it is not a problem.
First quarter data on productivity and unit labor costs were not good. This is understandable given the slowdown in the quarter. Productivity (output per person hour) declined 3.1% and inflated unit labor costs by 6.7%. Looking year over year, productivity is on the plus side but just barely (0.3%) with unit labor costs tame (1.8%). Should the second quarter see the bounce that many expect, productivity should improve and unit labor costs should cool.
The consumer started off the second quarter slowly, putting income into savings and not spending. Consumer spending was unchanged in April with deep declines in spending on both durable and non-durable goods (down 0.7% and 0.5% respectively). Personal income rose a solid 0.4%. The savings rate rose 0.4% to 5.6%. While all of this is positive for the long run, for the second quarter, the consumer will be the economy’s bread and butter given the weakness in manufacturing. This should be watched.
In May, consumers weren’t holding back when it came to buying cars and light trucks. The 17.7 million units sold (annual rate) was a large 7.6% gain from April.
The ISM’s manufacturing index was at 52.8 in May. This is up from 51.5 in April but down from 55.6 a year ago. Any reading above 50 is a sign that manufacturing is expanding.
Arizona Snapshot:
Due to technical changes in how certain contractors were taxed relative to history and the shift in reporting activity from contracting to retail, it will be difficult to decipher the retail numbers for a while.
In Greater Phoenix, as of May, the number of listings on MLS continues to decline (25,929 now vs. 29,748 a year ago). On the other hand, sales volume was up to 9,066 in May vs. 8,208 a year ago. Not surprisingly, median sales prices were up to $211,000 according to the Cromford Report.
The ratio of median new home prices as a percent of median resale prices declined to about 147%. This is good news. The ratio historically has been in the 120% range. During the worst of the new housing market, the ratio was up to as high as 204%. It now seems to be trending downward and is at its lowest level since 2008. This indicates that the housing market is moving toward normal but has a way to go. The lower ratio will help new homebuilders.


