August 15th, 2016
The Monday Morning Quarterback
A quick analysis of important economic data released over the last week
The economy remains slow and steady. Nothing exciting.
Retails sales were flat. This was worse than expected but points out a trend that retailers don’t like. Consumers, more so in this cycle than any past cycle, are spending relatively less on goods such as clothing and electronics and more on entertainment, health care and travel. This trend is not likely to reverse any time soon and does not bode well for retailers. But, the stock market seems to like it, at least for now.
U.S. Snapshot:
- The inventories/sales ratio for manufacturing and trade edged down to 1.39 in June compared to May. In May, the ratio was 1.40. It was 1.37 a year ago. As you can see from the chart below, the ratio is high by historic standards. If it gets too high, manufacturers will cut production to get the ratio back into line. This would slow employment growth. The only good news is that most of the excess appears to be in autos where sales momentum remains positive.
- Nationally, retail sales for July were flat compared to June and up 2.3% compared to a year ago. The bright spots of the release included motor vehicle and parts dealers and non-store retailers. On the other side, gasoline stations as well as electronics and appliance stores were among the weak points that pulled this month’s retail sales down.
- The University of Michigan consumer sentiment index for August was flat. August preliminary data shows the index at 90.4 compared to 90.0 in July and 91.9 a year ago.
- Nonfarm business sector labor productivity decreased at a 0.5% annual rate during the 2nd quarter of 2016 as output increased 1.2% and hours worked increased 1.8%. From the second quarter of 2015 to the second quarter of 2016, productivity decreased 0.4%. Increases in productivity are what make increases in the general standard of living possible. Hopefully, this is an aberration.
- According to the National Association of Realtors, median housing prices in the U.S. increased to $240,700 in the 2nd quarter of 2016. This is a 4.9% increase over a year ago.
Arizona Snapshot:
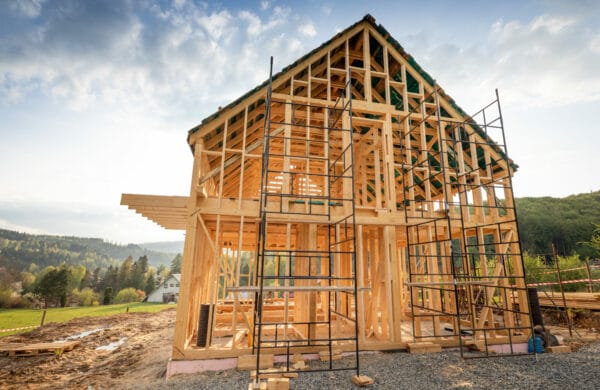
- According to the Home builders Association of Central Arizona, permits for new single family units declined in July when compared to a year ago. July produced 1,324 permits. This compares to 1,561 a year ago. This is the first year over year decline in a while. Hopefully it’s temporary.
- In Greater Tucson, permits increased over the same period from 192 units a year ago to 237 units in July.
- Data from the National Association of Realtors for the 2nd quarter shows that median housing prices in Greater Phoenix increased 7.7% over the past year. In Greater Tucson, median prices were up 5.1% over the past year.
- Housing affordability remained good in Greater Phoenix and Greater Tucson in the 2nd quarter (see chart below). Of the homes sold in Greater Phoenix, 65.8% were considered affordable to households with median income. This compares to 61.8% a year ago and 70.3% in the 1st quarter. In Greater Tucson, 75.1% of the homes sold were affordable to families with the median income in the 2nd quarter. This compares to 78.4% a year ago and 76.4% in the 1st quarter. By definition, an area where more than 50% of the homes sold were affordable to households with a median income, affordability is considered to be good.


