ELLIOTT D. POLLACK
FOR IMMEDIATE RELEASE
September 6th, 2016
The Monday Morning Quarterback
A quick analysis of important economic data released over the past week
The employment trend in the U.S. has earned the title of “the American job machine” by the chief economist of Moody’s Analytics. That machine continues to hum along and the U.S. economy is expected to be at full employment in the near future. The relative lack of available workforce has affected productivity but has increased wages and helped fuel consumer confidence, which has risen to its highest level in almost a year.
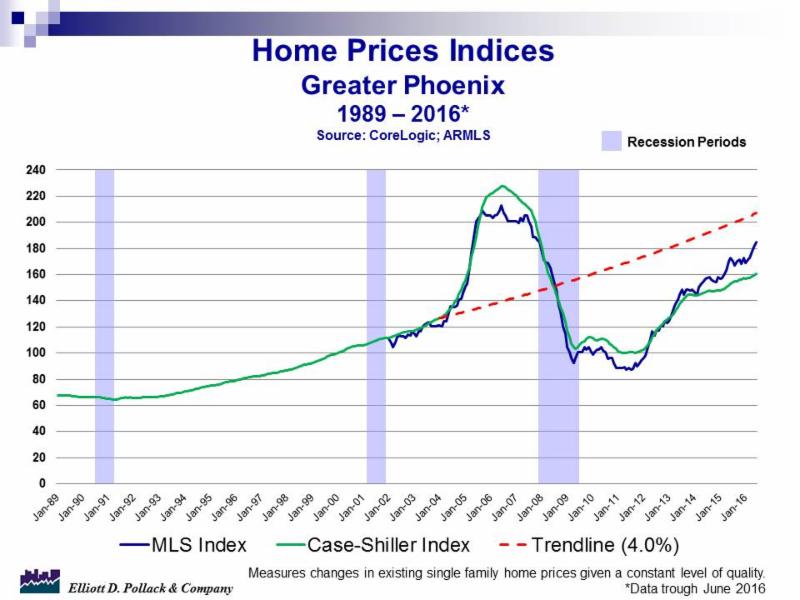
Locally, home price growth is the topic of the day. Based on two separate indices that we follow regarding home prices in Greater Phoenix, the MLS and Case-Shiller, we are getting closer and closer to what we would consider the long term average expected growth in home prices. The “bubble” that began in 2004 and burst by 2008 is easily identifiable. This is the period when home prices deviated from the long run average in home price appreciation. The correction has now extended over eight years but we are heading in the right direction and trending right back to historical averages (see chart below). While many fortunes were won and lost during this period, for those that stayed in their home the entire time, it will soon appear as if it never happened.
U.S. Snapshot:
- Initial unemployment claims continue at a level of what is considered historically low levels. Claims from the previous week are slightly higher on a week over week basis but lower on a 4-week moving average. Compared to last year, claims are 6.4% lower.
- Total nonfarm employment rose 151,000 in August after an upwardly revised gain of 275,000 in July. Combined, job gains have averaged 232,000 per month over the last 3 months. The 12-month average is 204,000 jobs per month. Employment is still 1.7% above a year ago. The largest sector gains were in educational and health services (39,000), trade, transportation, and utilities (34,000), and leisure and hospitality (29,000). Monthly declines were experienced in natural resources and mining (-4,000), construction (-6,000) and manufacturing (-14,000).
- The unemployment rate held steady at 4.9% in August. A year ago, it stood at 5.1%.
- Personal income grew by 0.4% in July and now stands 3.3% above a year ago. Disposable personal income is up 3.6% from a year ago and personal consumption expenditures are up 0.3% from June and 3.8% from a year ago. Thus, the savings rate has declined from 5.8% a year ago to 5.7%.
- Nonfarm business sector labor productivity declined at a 0.6% annual rate during the 2nd quarter and now stands 0.4% below a year ago. Unit labor costs in the nonfarm business sector increased 4.3% in the 2nd quarter (annualized) and are now 2.6% above a year ago. Labor cost increases resulted from a combination of a 3.7% increase in hourly compensation and a 0.6% decrease in productivity. This continued weakness in productivity is being blamed on the lack of investment in new equipment.
- New orders for manufactured goods in July were up 1.9% after being down for two consecutive months. New orders are still 3.5% below a year ago. Inventories increased 0.1% after 12 consecutive monthly decreases, but are still 2.9% below a year ago. The inventories to shipments ratio is unchanged from a month ago.
- The ISM manufacturing index fell below 50 in August (49.4) which is a general indication that the manufacturing economy is contracting. With a reading over 43.2 percent, however, it is an indication that the overall economy is still in expansion.
- July’s strong performance for vehicle sales did not continue in August. There were 17.0 million vehicles sold (annualized rate) in the month. This compares to 17.8 million units in July.
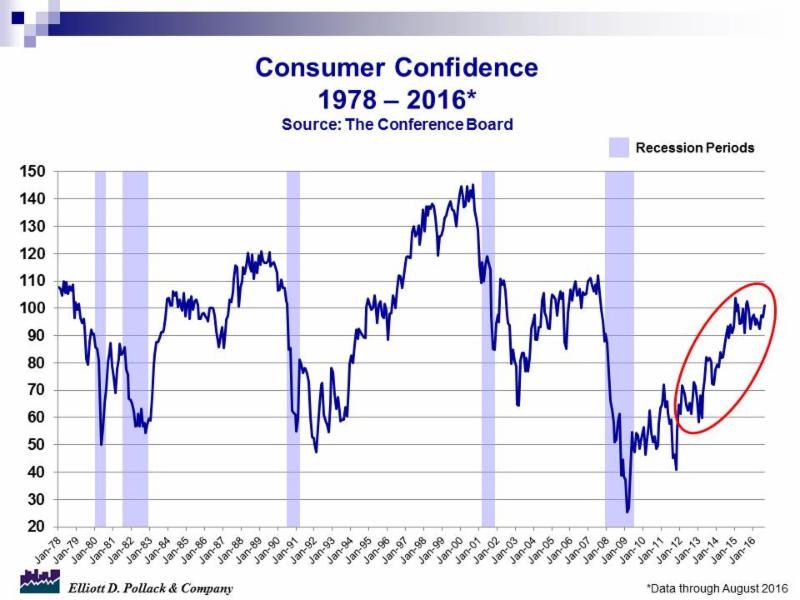
- The Conference Board’s consumer confidence index increased sharply to 101.1 in August from 96.7 in July. The index stood at 101.3 a year ago (see chart below).
- Construction spending in July was flat from June and now stands 1.5% above a year ago. Private residential construction was up 1.9% over last year, driven by strong multi-family growth and tepid single family growth.
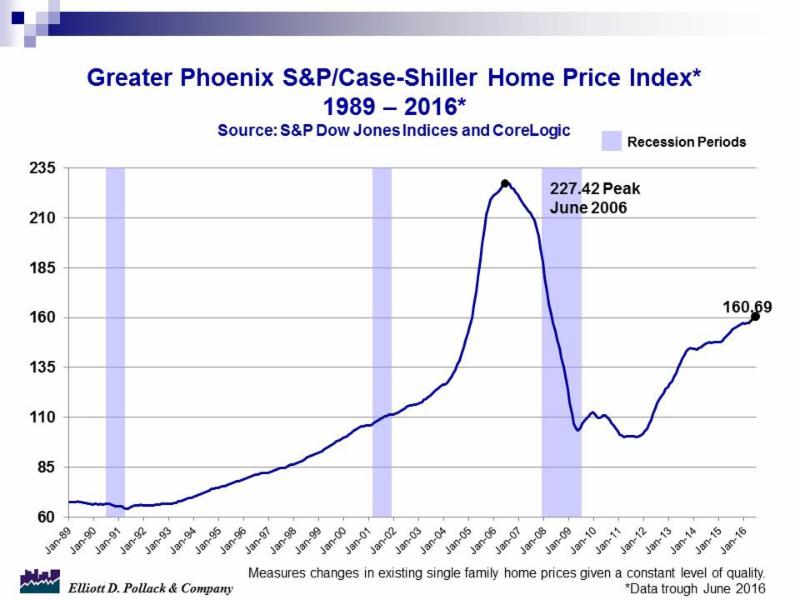
- The S&P/Case-Shiller home price index increased 0.8% in June compared to May and stands 5.1% over a year ago for the 20-city composite.
Arizona Snapshot:
- Arizona’s unemployment claims are 4.1% lower than last year.
- The Case/Shiller index also increased 5.1% for Greater Phoenix. The index now stands at 160.69 compared to the previous peak in June 2006 of 227.42 (see chart below).
|