ELLIOTT D. POLLACK
FOR IMMEDIATE RELEASE
October 24th, 2016
The Monday Morning Quarterback
A quick analysis of important economic data released over the past week
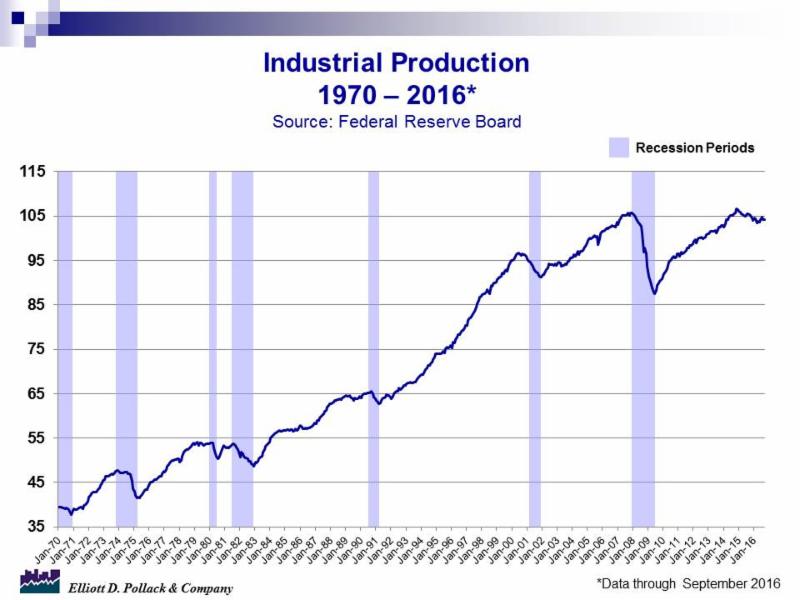
It was a busy week for meaningful economic data and most of the news was good. Nationally, leading indicators were up. Consumer prices are still under control. Single family activity was positive. And home builders remain optimistic. The only bothersome news was related to industrial production. While up, the long term chart (see below) on industrial production does not look healthy. The same is true for capacity utilization. While the economy continues to expand overall, these charts show a manufacturing sector that looks anemic.
In Arizona, employment continues to grow at a rate that, while disappointing by historic standards, is likely to be about as good as it gets in this cycle. The unemployment rate continues to decline. That’s good news. But, it remains at levels that are historically high for this point in the business cycle. Greater Phoenix remains the heart of the state’s economic engine. But, Tucson, according to the data, is doing surprisingly well. And in Greater Phoenix and Greater Tucson, the single family housing recovery remains intact.
Overall, not a bad week.
U.S. Snapshot:
- The index of leading indicators increased 0.2% in September. This follows a 0.2% decline in August and a 0.5% increase in July. The pickup in the six month growth rate suggests that the economy should continue expanding at a moderate pace through early 2017.
- Industrial production is a good news/bad news story. It was up last month, but, has been weak for this point in the cycle over the past couple of years. It edged up 0.1% in September after falling 0.5% in August (see chart below). On a quarterly basis, 3rd quarter industrial production rose at an annual rate of 1.8%. This is the first quarterly increase since 2015 Q3.
- Output from manufacturing increased 0.2% in September and increased at an annual rate of 0.9% in the third quarter. However, Industrial production is down 1.0% from a year ago and the long term chart shows a less than robust picture over the past two years.
- Capacity utilization for the industrial sector increased by 0.1% in September to 75.4% (see chart below). This rate is 4.6 percentage points below the long term (1972-2015) average.
- Consumer prices as measured by the CPI for all urban consumers increased 0.3% in September on a seasonally adjusted basis. It now stands 1.5% over a year ago. The CPI less food and energy, known as the base rate of inflation, increased 0.1% for the month and currently stands 2.2% over year earlier levels. The largest increases were in shelter and medical care costs.
- Privately owned housing units authorized by building permits in September were up 6.3% from August and 8.5% over a year ago.
- Existing home sales rebounded strongly in September and were driven by sales from first-time buyers reaching a 34% share. This is the highest level in four years according to the National Association of Realtors. Total existing home sales were up 3.2% for the month and now stand 0.6% over a year ago.
Arizona Snapshot:
- Arizona gained 32,700 nonfarm jobs in September over August. This was more than the post-recession average of 25,700 for the month. Over a year ago, the state has gained 2.3% or 61,800 jobs. Employment in the state is up 2.8% year-to-date through September. The gains for the month came in government, educational and health services and construction.
- Employment gains in Greater Phoenix were 1.1% for month. But, the area was up 3.2% year over year for the first nine months of 2016. Greater Tucson was up 2.1% for the month and now stands up 3.0% for the first nine months of the year. This is a surprisingly strong showing in Tucson. Prior to this year, the employment gains in Tucson had been very anemic. It will be interesting to see benchmark revisions that come out in February.
- Arizona’s seasonally adjusted unemployment rate declined from 5.8% to 5.5% in September. The seasonally adjusted U.S. rate increased to 5.0% from 4.9% in August. A year ago, the Arizona rate was 5.9% and the U.S. rate was 5.1%. The unemployment rate in Greater Phoenix was 4.8% and in Greater Tucson it was 5.2%.
- According to R. L. Brown, there were 1,512 single family permits in September. That’s up from 1,391 permits a year ago. The gain was 8.7%. Year-to-date, 13,853 housing permits have been issued. That’s 12.7% above the 12,293 permits issued through the same period a year ago.
- In southern Arizona, activity was also up. The 218 single family permits issued in September represents a 16.0% increase from a year ago. Year-to-date, there have been 2,035 permits issued in Greater Tucson. That’s up 24.4% over the similar 2015 period.
 
|


