Pollack: Slowest expansion in American history

EDPCo Banner Logo
The Source for Information and Analysis on the Arizona Economy and Real Estate
EDP Logo

ELLIOTT D. POLLACK

& Company

FOR IMMEDIATE RELEASE
October 3rd, 2016
 
The Monday Morning Quarterback
A quick analysis of important economic data released over the past week
Well, at least we are still expanding.  That’s the good news.  But, the latest data from the Bureau of Economic Analysis shows that this is probably the slowest expansion in American history.
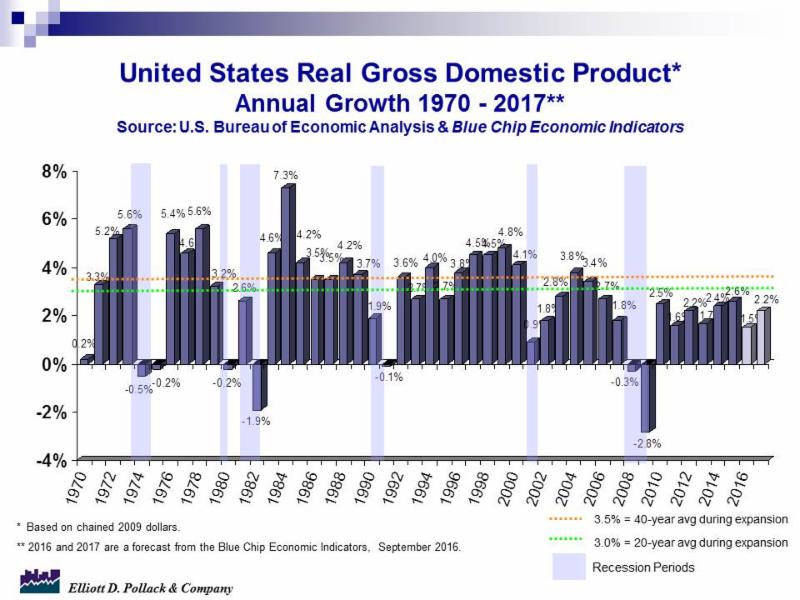
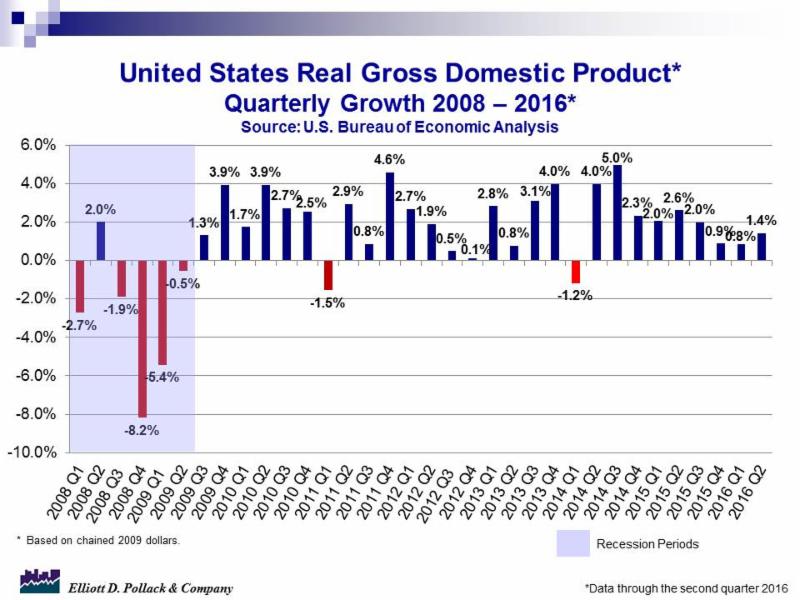
Just how slow this expansion has been can be seen by the latest GDP release.  Real gross domestic product increased at an annual rate of just 1.4% in the second quarter of 2016.  This follows growth rates of just 0.9% in the 4th quarter of 2015 and 0.8% in the 1st quarter of 2016.  To put this in perspective, the average annualized quarterly growth rate in the March 1991-March 2001 expansion was 3.6%.  In the November 2001-December 2007 expansion, the rate was 2.8%.  Until this cycle, that had been the slowest post-war recovery.   Other post-war expansions have averaged 3.2%-6.2% at an annual rate.
Even jobs have grown at a rate that is the slowest on record.
This dismal record is a result of, among other things, bad economic policy.  This includes higher taxes on both individuals and corporations, costly and oppressive regulations, barriers to international trade and barriers to credit creation.  Whoever wins the election must change these policies or the results we have seen will continue.
In other news, despite what appears to be an agreement by OPEC members to constrain supply by about 2%, it remains to be seen if oil prices rise much.  That will depend on many factors including how non-OPEC members react and how long such a decline in output by OPEC members actually lasts.
The overall data suggests that the current expansion will still continue.  Personal income continues to grow.  Consumer confidence is up.  New home sales are up from a year ago.  Home prices continue to recover.  And closer to home, statewide lodging statistics continue to improve.
U.S. Snapshot:
  • Jobless claims remain very low and continue to point to strength in the labor market.  Initial claims inched 3,000 higher in the September 24th to 254,000 though the 4-week average is down 2,250 to 256,000.  This suggests continued declines in the unemployment rate.
  • Corporate cash flows were down 0.6% in the 2nd quarter compared to the 1st quarter and down 1.9% from a year ago.  As can be seen by the chart below, corporate cash flows have been on a plateau since 2010.
  • Personal income increased 0.2% in August.  It now stands 3.1% above a year ago.  Disposable personal income also increased 0.2% and is now 3.4% above last year.  Finally, personal consumption expenditures did not change in August over July but increased 3.6% over a year ago.  These are all indicators that consumers are still in good shape.
  • The personal savings rate was 5.7% in August compared to 5.6% in July and 5.9% a year ago.
  • Both major indicators of consumer confidence were up.  The Conference Board consumer confidence index rose to 104.1 from 101.8 in August and 102.6 in September 2015.  This is the highest reading since 2007.  The University of Michigan consumer sentiment index for September rose to 91.2 compared to 89.8 in August and 87.2 a year ago.  While not the highest reading of the cycle, it indicates a high level of confidence.
  • Sales of new single family homes in August were at a level that was down 7.6% from July but up 20.6% from a year ago.
  • The S&P CoreLogic Case-Shiller national home price index for the 20 city composite was up 5.0% in July from a year ago.  The national index is within 0.6% of the record high set in July 2006.  Seven of the 20 cities have already set new record highs.
Arizona Snapshot:
  • Statewide occupancy rates were 58.2% in August.  This is up from 56.8% a year ago.  Over that period, demand was up 3.6% and supply was up 1.1%.
  • The July Case-Shiller home price index for Greater Phoenix was up 0.8% from June and 5.2% from a year ago.  The increase will have the same effect locally as it will nationally.  More home owners with mortgages will be above water and will have the flexibility to move.  This will eventually accrue to the benefit of Greater Phoenix.
Share this!

Additional Articles

News Categories

Get Our Twice Weekly Newsletter!

* indicates required

Rose Law Group pc values “outrageous client service.” We pride ourselves on hyper-responsiveness to our clients’ needs and an extraordinary record of success in achieving our clients’ goals. We know we get results and our list of outstanding clients speaks to the quality of our work.

October 2016
M T W T F S S
 12
3456789
10111213141516
17181920212223
24252627282930
31