ELLIOTT D. POLLACK
& Company
FOR IMMEDIATE RELEASE
November 5th, 2018
The Monday Morning Quarterback
A quick analysis of important economic data released over the last week
Nationally, the picture is hard to beat at the moment as the boom continues. Total non-farm payroll jobs continue to grow rapidly. In October, 250,000 jobs were added. That compares to an expectation of 200,000. The unemployment rate continues to be at a 49-year low. While wages are growing at close to 3%, productivity growth is sufficient to keep unit labor cost under control (this is the best measure of how much pressure wages are putting on corporate margins).
In addition, personal income growth is high enough to allow personal consumption expenditures to rise at a strong level. And consumer confidence continues to rise. It should be a good holiday season from an economic standpoint.
Manufacturing also continues to do well. The ISM index remains in positive territory. New manufacturing orders are up, and exports continue to rise. Even total construction is up despite the recent slowdown in single family sales.
In both Greater Phoenix and Greater Tucson, home prices continue to rise. This is a double-edged sword. On the positive side, it creates more equity for those who own homes. On the negative side, price increases combined with the expected increase in mortgage rates will affect affordability. Housing affordability in Arizona remains excellent relative to most of the major markets in the country. Thus, while it could cause a modest slowdown in housing in the state, any slowdown is likely to be modest relative to other markets. When you combine that with what can only be described as excellent demographics for housing and the lack of any oversupply that haunted the state during the great recession, it is difficult not to be relatively optimistic about the future of single family housing especially in Greater Phoenix and Greater Tucson.
Overall, the picture both nationally and locally is excellent at the moment.
U.S. Snapshot:
-
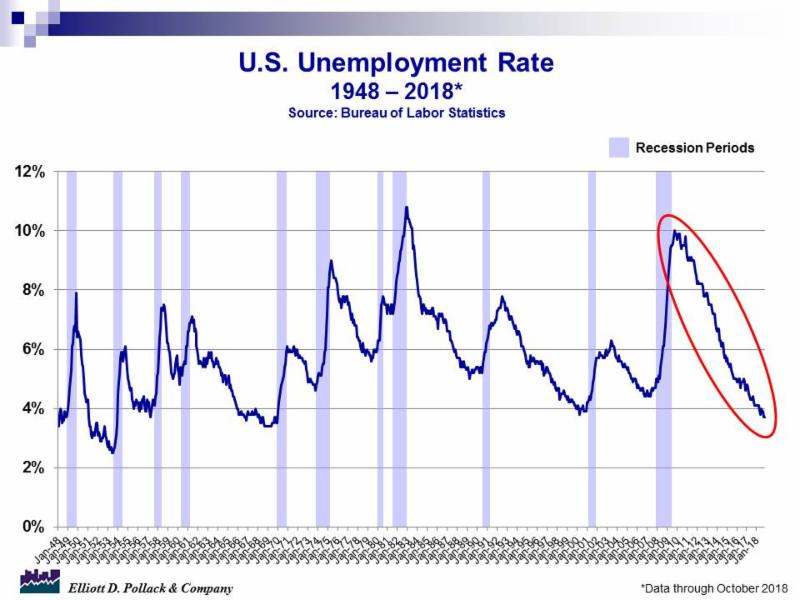
Total nonfarm payroll employment rose by 250,000 in October This compared to expectations of 200,000. The average monthly gain over the last 12 months has been 211,000. Job gains occurred in health care, manufacturing, construction, and transportation and warehousing. The unemployment rate was unchanged at 3.7%. This remains a 49-year low (see chart below). Employment gains in September were revised downward from 134,000 to 118,000. August numbers were revised upward from 270,000 to 286,000.
-
Consumer confidence rose in October to 137.9. That’s up from 135.3 in September and 126.2 a year ago.
-
Average hourly earnings for all employees in private nonfarm payrolls rose 83 cents or 3.1% over the past year.
-
Nonfarm business sector labor productivity increased 2.2% during the third quarter as output rose by 4.1% and hours worked rose by 1.8%. Over the past year, productivity rose 1.3%. Unit labor costs in the nonfarm business sector increased by 1.2% in the third quarter. This reflected a 3.5% increase in hourly compensation and a 2.2% gain in productivity. Over the past year, unit labor costs increased 1.5%.
-
The employment cost index for civilian workers rose 2.8% over the past year.
-
Personal income rose at a 2.4% annual rate in September when compared to August and now stands 4.4% over year earlier levels. Over the past year, disposable personal income rose 4.9% while personal consumption expenditures rose 5.0%. The personal savings rate declined to 6.2% in September. Year earlier levels were 6.6%.
-
The ISM’s manufacturing index registered 57.7 in October. This compares to 59.8 in September and 58.5 a year ago. Any reading of 50 or more suggests that the manufacturing sector is expanding.
-
Manufacturers’ new orders were up 0.7% in September when compared to August and are up 7.9% from year earlier levels.
-
Construction spending during September was flat compared to August and stood 7.2% above year earlier levels. Both private and public sector construction were up from a year ago.
-
The S&P/Case-Shiller home price index for the 20-city composite was flat in August when compared to July. The index was up 5.5% compared to year earlier levels.
Arizona Snapshot:
-
Enplanements were up 2.5% in September compared to a year ago. Deplanements were up 3.4% over the same period.
-
According to the S&P/Case-Shiller home price index, home values in Greater Phoenix were up 7.0% from year earlier levels in August.
About EDPCo
Elliott D. Pollack & Company (EDPCo) offers a broad range of economic and real estate consulting services backed by one of the most comprehensive databases found in the nation. This information makes it possible for the firm to conduct economic forecasting, develop economic impact studies and prepare demographic analyses and forecasts. Econometric modeling and economic development analysis and planning are also part of our capabilities. EDPCo staff includes professionals with backgrounds in economics, urban planning, financial analysis, real estate development and government. These professionals serve a broad client base of both public and private sector entities that range from school districts and utility companies to law firms and real estate developers.
For more information, contact –
Elliott D. Pollack & company
7505 East Sixth Avenue, Suite 100
Scottsdale, Arizona 85251
480-423-9200


