FOR IMMEDIATE RELEASE
May 6th, 2019
The Monday Morning Quarterback
A quick analysis of important economic data released over the last week
Last week’s economic news paints quite a picture.
Employment is growing at twice the rate necessary to keep pace with growth in the working-age population. This, as a result, will pull more unemployed workers into the labor force. In addition, employment also grew well above expectations. The unemployment rate is now at a nearly 50-year low.
Personal income continues to grow at a faster pace than inflation. Consumer confidence was up and remains at a high level. And both the manufacturing and non-manufacturing sectors continue to expand. The FED also felt good enough about the economy to keep rates steady. So, interest rates will remain low by any historic measure.
When you combine all of this with continued real GDP growth reported last week and inflation that is below the FED’s 2.0% target, it’s an amazing picture for an economic expansion that is approaching its 10th birthday and will soon be the longest period of growth in U.S. history. Who’d a thought it?!?!
In addition, the normal indicators that signal the end of the cycle are not giving off negative signals at the present time. So, while the economy is clearly late in the cycle, it’s not over yet. Clearly, at some point in the future, we will look back at the current set of economic circumstances in awe. This can’t last forever. And it’s far too early to be certain as to what the next downturn will look like. So, try to enjoy it while you can.
There are some continued weaknesses in what has been a better than expected picture. The housing market in many cities, mainly large coastal cities, seems overpriced. And affordability in general is an issue. It’s difficult to see how this will play out well. The effect of the tax cuts will continue to wear off and, therefore, real GDP growth is likely to slow as the rest of the world continues to have tepid economic growth that affects trade. And watch inventories.
One other comment. The question of why the economy has been so good for so long is starting to be spun by both sides of the aisle. Let’s make one thing clear. Policy does matter. Slow growth policies created slow growth when economic growth should have been more rapid. Faster growth policies have created faster growth than is typically expected later in the cycle. Tax policy. Regulatory policy. Fed policy. Trade policy. They all matter.
U.S. Snapshot:
The labor market keeps surprising. Payroll employment increased by 263,000 jobs in April. That’s well above expectations of 190,000. It’s also twice the rate of increase needed to keep pace with growth in the working age population. Thus, it continues to pull in more unemployed workers. As a result, the unemployment rate declined to 3.6%, its lowest rate in nearly 50 years (see chart below). With the recognition that jobs are becoming increasingly difficult to fill, employers are hanging on to their workers and workers are easily jumping ship and finding new positions. Given that the recovery/expansion is now approaching 10 years, this is a great performance.
The Federal Reserve held interest rates steady and signaled little appetite to adjust them any time soon. Taking heart in continued job gains and economic growth and the likelihood that weak inflation will edge higher. According to FED chairman Jerome Powell, “We don’t see a strong case for moving it (the target FED funds rate) in either direction.”
Consumer confidence recovered from March’s decline and continues to stand at high levels. The index rose to 129.2 in April compared to 124.2 in March and 125.6 a year ago. The improvements came in attitudes about the business climate and in the labor market.
Personal income increased 0.1% in March. It now stands 3.8% above year earlier levels. This is above the rate of inflation. Disposable personal income was flat for the month but is up 3.9% above a year ago. The increase in personal income in March primarily reflected increases in compensation of employees and government social benefits to persons that were partially offset by decreases in personal interest income and farm income.
According to the ISM manufacturing index, the manufacturing sector continued to expand in April. It’s the 32nd consecutive month of expansion. The index was 52.8 in April compared to 55.3 in March and 57.9 a year ago. Any reading above 50 suggests that the manufacturing sector is expanding.
The ISM non-manufacturing index also gave a reading that suggests continued expansion of the non-manufacturing sector in April. The index was 55.5 in April compared to 56.1 in March and 57.2 a year ago. It was the 111th consecutive month of expansion in the index. Again, any reading above 50 indicates expansion.
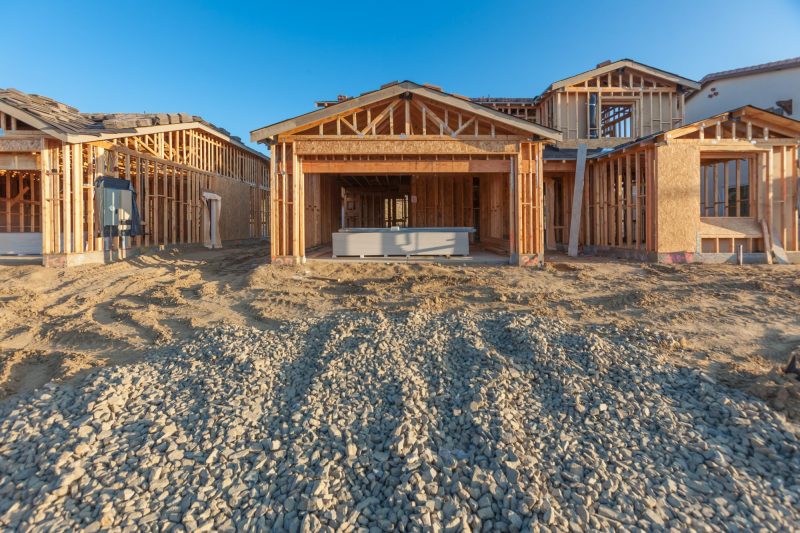
Construction spending fell by 0.9% in March compared to February and now stands 0.8% below year earlier levels.
The NAR pending home sales index was up in March to 105.8. In February, it was 101.9. A year ago it was 107.1. According to Laurence Yun, the Realtor’s chief economist, “We are seeing a positive sentiment from consumers about home buying as mortgage applications have been steadily increasing and mortgage rates are extremely favorable.”
The S&P/Case-Shiller Home Price 20-city composite index rose 0.2% in February compared to January and now stands at 3.0% over a year ago. A year ago, prices were up 7.7% from year earlier levels. Thus, new home price increases are moderating. The largest year over year price increase was 9.7% in Las Vegas.
Arizona Snapshot:
Statewide Real GDP increased in 49 states and the District of Columbia in 2018. Arizona ranked 4th in terms of statewide real GDP growth in 2018. This is more evidence of how well the state is doing economically relative to other states.
Home prices in Greater Phoenix were up 6.7% over year earlier levels in February according to the S&P/Case-Shiller home price index. Only Las Vegas had a more rapid increase. This is a negative for affordability in both absolute and relative terms and is not likely to continue.
March data from Sky Harbor in Phoenix indicated continued growth in the market. Enplanements rose 4.7% above year earlier levels. Deplanements rose 1.9%. Overall, total activity was up a rapid 3.3% from a year ago.

About EDPCo
Elliott D. Pollack & Company (EDPCo) offers a broad range of economic and real estate consulting services backed by one of the most comprehensive databases found in the nation. This information makes it possible for the firm to conduct economic forecasting, develop economic impact studies and prepare demographic analyses and forecasts. Econometric modeling and economic development analysis and planning are also part of our capabilities. EDPCo staff includes professionals with backgrounds in economics, urban planning, financial analysis, real estate development and government. These professionals serve a broad client base of both public and private sector entities that range from school districts and utility companies to law firms and real estate developers.
For more information, contact –
Elliott D. Pollack & company
7505 East Sixth Avenue, Suite 100
Scottsdale, Arizona 85251
480-423-9200