ELLIOTT D. POLLACK
& Company
FOR IMMEDIATE RELEASE
September 30, 2019
The Monday Morning Quarterback
A quick analysis of important economic data released over the last week
The most interesting economic issue that went on last week wasn’t something that made big headlines. So, that lets out the beating of the impeachment drum. It was issues with the repo, or repurchase agreement, market.
The repo market is where participants, usually banks or other large participants in financial markets, exchange treasury bonds for cash with an agreement to reverse the transaction in a short period of time, usually from one day up to a few days. The purpose is to fill very short-term cash needs for some financial institutions with those who have short-term excess cash.
Over the past few weeks, there have been days where not enough banks or money market funds have been willing to part with their cash. The FED has stepped in to fill the void. This is a technical problem. There’s more than $1.3 billion in excess bank reserves (cash) at the FED. Of this, banks could have had enough free reserves to fill the void. But they chose not to. Instead, they kept their cash at the FED. This is their right. They are under no legal or moral obligation to lend the funds. Since they earn 1.9% at the FED, they aren’t really losing anything. If banks don’t want to lend to each other, then those needing short term cash can go to the FED. The FED can lend an unlimited amount if they choose to.
The FED didn’t pay interest on excess reserves until 2008 and they don’t have to pay interest on the reserves. But, as of today, they do. With interest rates so low, the incentives have changed. This is really a non-story because all the FED has to do to change the incentives is lower the rate they pay on repos. That would end the problem and the story would drop out of the news cycle altogether. There is really no reason to worry about this issue. But, given the nature of the issue, we wanted to go over it for all of you.
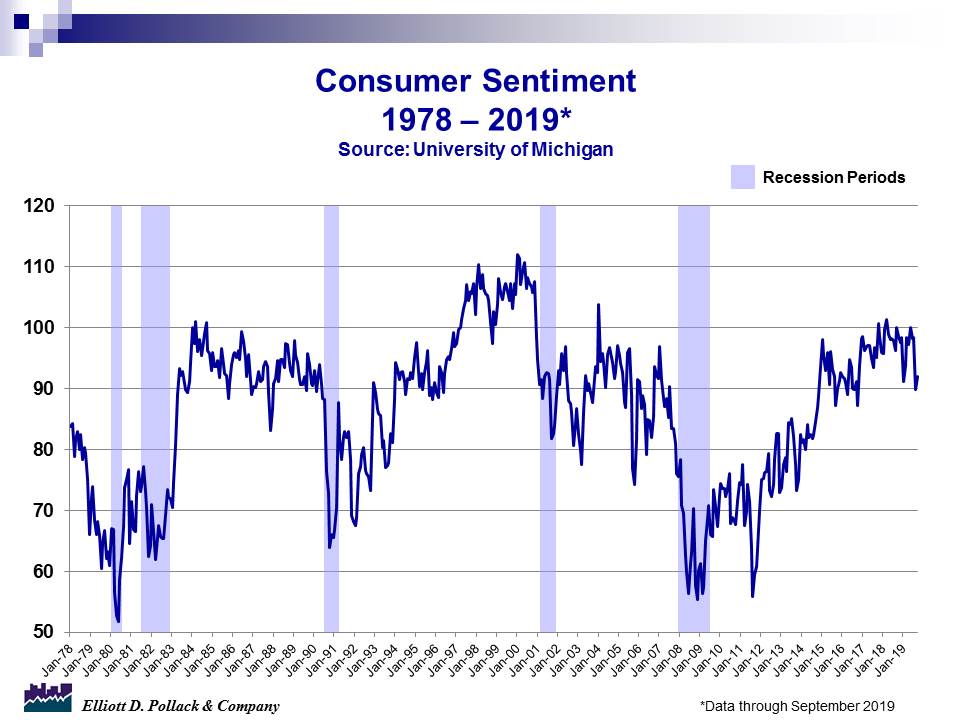
The other interesting reports were on consumer confidence. A few weeks ago, the Conference Board measure remained high and the University of Michigan measure declined. This month, the Conference Board measure declined and the University of Michigan measure rebounded from last month’s low. Basically, the trends remain favorable.
In other measures of economic activity, manufacturers’ new orders were up for the month but remain down from a year ago. New home sales were up. Pending existing home sales were up and home prices continued to moderate nationally.
In Arizona, lodging performance improved and housing prices increased.
U.S. Snapshot:
The Conference Board Consumer Confidence Index declined from 134.2 in August to 125.1 in September. This compares to 135.3 a year ago. September’s drop puts the index toward the low end of the range reported in recent years. Even so, it remains pretty solid in the context of this expansion and even historically (see chart below).
The University of Michigan Consumer Sentiment Index, which dropped significantly last month, recovered in September. The index rose to 93.2 from 89.8 last month and compares to 100.1 a year ago (see chart below). This was due to more favorable income trends especially among middle-class households.
Manufacturers’ new orders for durable goods rose 0.2% in August relative to July. They are down 3.0% from year-earlier levels. Excluding the volatile aircraft sector, non-defense goods fell 0.2% for the month and are down 0.3% from a year ago.
New home sales rose 7.1% for the month in August and stood 18.0% above a year ago. This is very strong. Median sales prices were up 2.2% over a year ago.
The National Association of Realtors pending home sales index in August was up 1.6% from July and 2.5% from year-earlier levels.
The S&P/Case-Shiller national home price index (20-city composite) was up 2.0% from a year ago. The 10-city composite was up 1.6% for the same period. This shows that home price increases have slowed significantly over the past year. Phoenix, Las Vegas and Charlotte reported the highest year over year gains among the 20 cities.
Arizona Snapshot:
Lodging performance continues to improve in the state. Occupancy rates were 64.6% in August. This compares to 61.3% a year ago. That’s a 5.4% gain. Demand grew 5.8% over the same period while supply grew by a modest 0.4%.
According to the Greater Phoenix S&P/Case-Shiller home price index, home prices in Greater Phoenix for the year ended July were up 5.8%. This is the largest increase among the 20 cities in the composite index and suggests that there is still a significant demand/supply imbalance in Phoenix relative to the rest of the country.


About EDPCo
Elliott D. Pollack & Company (EDPCo) offers a broad range of economic and real estate consulting services backed by one of the most comprehensive databases found in the nation. This information makes it possible for the firm to conduct economic forecasting, develop economic impact studies and prepare demographic analyses and forecasts. Econometric modeling and economic development analysis and planning are also part of our capabilities. EDPCo staff includes professionals with backgrounds in economics, urban planning, financial analysis, real estate development and government. These professionals serve a broad client base of both public and private sector entities that range from school districts and utility companies to law firms and real estate developers.
For more information,
contact –
Elliott D. Pollack & company
7505 East Sixth Avenue, Suite 100
Scottsdale, Arizona 85251
480-423-9200


