FOR IMMEDIATE RELEASE
June 22, 2020
The Monday Morning Quarterback
A quick analysis of important economic data released over the last week
The state and its major metro areas have turned an economic corner. The state gained 45,300 jobs last month. This net gain consisted of private sector job gains of 58,900 and government sector jobs losses of 13,700 mainly due to the seasonal hiring pattern surrounding schools. Considering that the state didn’t reopen until May 16th, this was a good showing. Keep in mind that employment is still down 163,100 jobs from a year ago. But, last month, employment was down 218,800 jobs from a year ago. So, we are moving in the right direction. The recovery has started.
The gainers in employment were the usual suspects. The biggest winner was Leisure and Hospitality. That sector accounted for 63.1% of the private sector gain. Education and Health Services accounted for 15.3% of the private sector gain. And Trade, Transportation and Utilities accounted for 9.1% of the private sector gain.
Seasonally adjusted employment increased 2.4% for the month, which was above the national increase. Keep in mind also that the decline in Arizona was considerably less than the country as a whole. From the February peak to the April trough, national employment declined 12.8%. Statewide, Arizona’s decline was “only” 7.7%.
Also worth noting was the significant decline in the state’s unemployment rate. From an unemployment rate of 13.4% in April, the May level fell to 8.9%. This compares to the national numbers that fell from 14.7% in April to 13.3% in May.
Retail sales were up 17.7% month-over-month. This far exceeded expectations. The jump is retail sales is a wild cry from those who have been sequestered for too long. It means, “Let me outta here now!!” Auto sales were way up. Even without that, it was a strong month. Overall, retail sales were only 6% below a year ago on a national level.
How long the “boomlet” lasts depends on the size and shape of what follows the CARES Act and how much employment continues to rise.
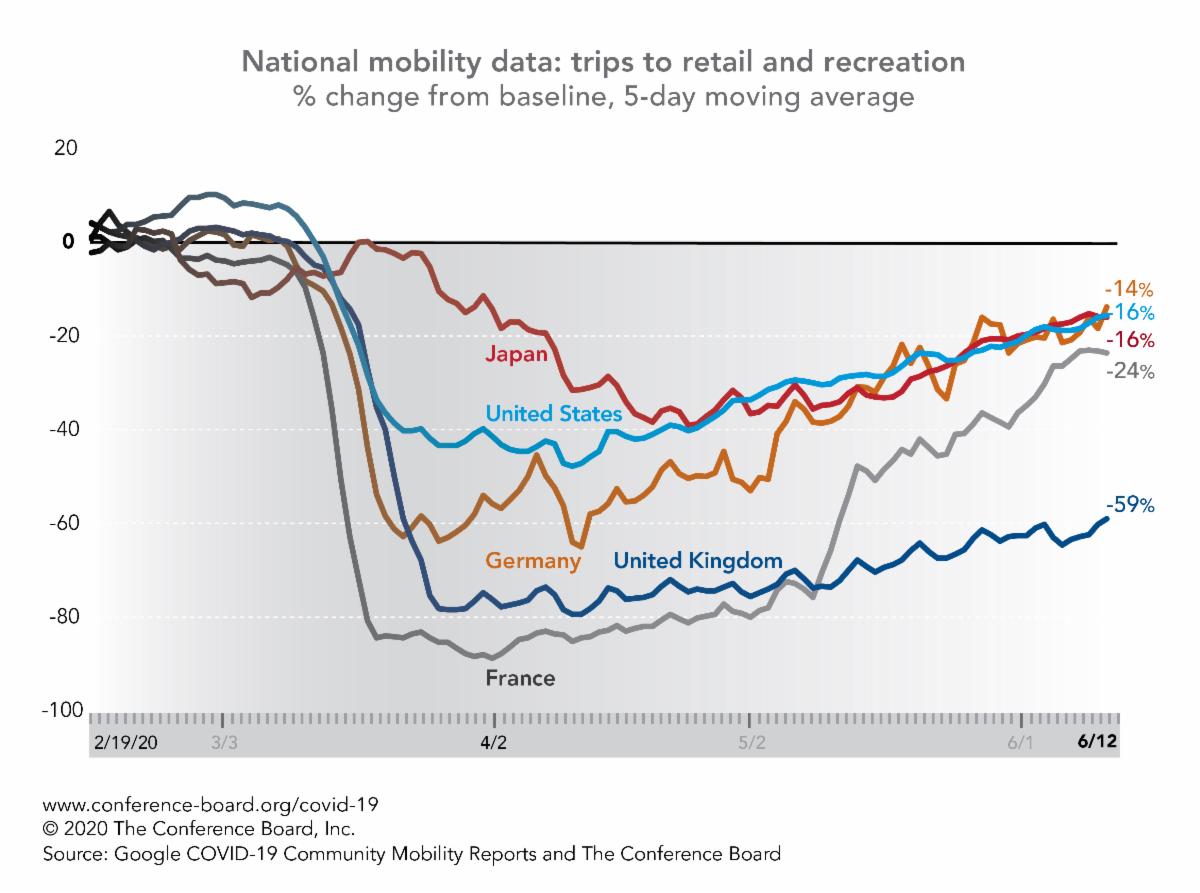
The Conference Board has been tracking the COVID-19 slump in retail and recreation traffic (see chart). Their conclusion is simple. “The data in the chart clearly shows that in every country, the initial drop in traffic to shops and entertainment was swift. However, the rebound toward pre-pandemic levels takes a lot longer, even after restrictions are lifted. These data are a good reminder that shutting down is easier than opening up.”
Another sector that appears to be recovering rapidly is housing. While resale activity is off from a year ago, the decline in activity is less than virtually anyone anticipated. In addition, after slumping in March and April, mortgage applications for single family purchases are now up 20% over a year ago.
At the local level, the issue for housing appears to be a shortage of supply for sale. In a price range between $100,000 and $350,000 there is at least a one month of supply of homes on the market at the present time. Between $350,000-$500,000 supply is less than 1.5 months. These are very low numbers suggesting that many buyers cannot find what they are looking for.
There was also some less than sanguine information as well. More than 100 million loan accounts in the country are on some type of relief program that allows the borrower to skip payments. This includes mortgage forbearance, as well as rent, student loan, credit card and auto loan payment deferments. About 79 million student loans are in a relief program. 7.3 million auto loans are in the same situation. So are 1.3 million personal loans. And don’t forget over 5 million mortgage loans in forbearance, millions who are just not paying their rent or are seeking credit card relief. That people are having trouble with this many loans despite the relief provided by the CARES Act is disturbing. Lenders are likely to be more cautious making loans going forward as they try to balance credit risk with the FED’s wish to make credit available to those who, under normal circumstances, get credit. In addition, given the rapid rise in cases and the number of cities and states that have again become concerned enough to mandate masks, social distancing and smaller crowds, there are now more headwinds against the recovery.
The CARES Act basically runs out in August. While there has been much discussion about a follow up program (The HEROES Act), given the current political situation in Washington, a positive outcome cannot be assured quite yet. It is becoming more and more important to make sure that those who are unemployed receive funds to keep them from digging financial holes that would condemn them to a long recovery for the next few years. This would make the national recovery as a whole move less rapidly. At the same time, this new act must do away with the perverse incentives that were contained in the CARES Act. Time is running short.
In Arizona, revisions in the way deaths are calculated have not changed the pattern. The number of deaths is still declining. On the other hand, the number of confirmed cases continues to increase. The increased number of people tested does not explain the entire increase. Our political leaders made the adjustment necessary to get thing back under control without shutting down the economy again. I believe the moves made were the proper ones. But, the effects that increase in cases and the requiring of masks, etc. will have on individual desires to go out to restaurants, bars, retail stores, travel and so on remains to be seen. Certainly, it will not speed things up.
The good news is that this is temporary. Economic development activity continues to be brisk. And the employment numbers suggest that the state will continue to do well compared to the U.S. as a whole. This is a work in progress. It is difficult. And there is still no real solution (vaccine or something that mitigates the effects of COVID-19) in sight. At least states are making some adjustments that hopefully will cool the rapid run up of bad information.
One other good piece of information. Arizona on a year-to-date basis is the second most rapidly growing (actually declining less than all but Utah) and Greater Phoenix on a year to date basis is doing better than any other major metro area in the country through May. This bodes well as the economy continues to recover.
As for weekly indicators, U.S hotel occupancy rates continue to slowly improve. Occupancy rates were 41.7% last week compared to 32.4% for the week of May 18th. The bad news is that occupancy rates are still down 42.1% from a year ago. TSA weekly traveler throughput at airports was 3,055,652 for the week of June 13th compared to 1,435,067 the week of May 16th. This week’s numbers are 82.3% below a year ago. A month ago, they were down 91.3%. Progress? Yes. But, very slow. Seated diners also improved. But, slowly. In Greater Phoenix, seated diners were 51.2% below a year ago. A month ago, the decline was almost 84%.
In terms of travel to the workplace, Greater Phoenix was down 32.1% and Greater Tucson was down 29.3% compared to a year ago. A month ago, the numbers were 41.3% and 38.7% respectively. Better. But, with much of the state going back to masks and social distancing, this may slow more. Travel to retail and recreation was down 21.6% in Greater Phoenix last week compared to a year ago. Tucson was down 22.7%. Again, an improvement but a small one.
The other data we will go over today is the same type of good, bad, and ugly we described a couple of weeks ago. The good (or at least better than expected). The employment numbers, the unemployment rate, housing, retail sales and interest rates. The bad. Initial claims for unemployment insurance, leading indicators, and industrial production. The ugly. Everything is relative. What would have been considered ugly pre-COVID-19 is now considered good or bad.
U.S. Snapshot:
- Initial jobless claims increased by 1,508,000 last week. That’s down slightly from the previous week’s 1,566,000. But it was still 588% above year earlier levels. Since the week of March 21st, 45,738,000 initial jobless claims have been filed.
- The Index of Leading Indicators show that the worst of the COVID-19 shock was likely over in May. Still, the economy faces a long and uncertain recovery. The index increased to 99.8 in May. That’s up from 97.1 in April and down from 111.6 in May 2019.
- Retail sales had a much better than expected month in May. Consumers were obviously anxious to get out again. Auto sales, which account for 20% of retail sales, increased by 44%. But, even excluding auto sales, retail sales were still up 12.4%. Clothing sales were up significantly as well but from a low base. Overall, retail sales were just 6.1% below year earlier levels. This was a good showing. The question now becomes what happens if the government doesn’t have a significant follow up to the CARES Act. The major stimulus from that act basically ends on August 1. Without a follow up act, retail sales could weaken.
- Industrial production rose 1.4% in May but is still 15.3% below year earlier levels. The May number was well under expectations. This, combined with continued low capacity utilization figures (64.8% in May vs. 64.0% in April and 77.8% a year ago), suggest that we have a long way to go to get back on an even keel.
- The NAHB Housing Market Index jumped up 21 points to 58 in June. That compares to 37 in May and 64 a year ago. This increase indicates that the economy and housing market are starting to recover from COVID-19 and the mandatory lockdowns implemented to contain the virus.
- Housing starts edged higher in May, rising from 934,000 at an annual rate in April to 974,000 at an annual rate in May. A year ago, starts were 1,268,000 at an annual rate. The May figures were below expectations. Permits did better in May, increasing from 1,066,000 in April to 1,220,000 in May. A year ago, there were 1,338,000 starts. Thus, while starts were down 23.2% in April, permits were down only 8.8%.
Arizona Snapshot:
- Initial claims for unemployment insurance in the state for the week of June 13th were 22,419. This is below the preliminary number of 28,522. Since the week of March 13th, 676,501 Arizonans hive file initial claims. That represents 22.7% of the mid March level of employment.
- The employment data for May was very good and suggests that the COVID-19 induced recession is over. Statewide employment grew by 45,200 in May. That’s a gain of 1.7% (not seasonally adjusted) for the month. That is an annual rate of over 21.9%. While employment is still down 163,100 from a year ago, it was a good start for the employment recovery. The gains were exactly where one would have expected. Leisure and Hospitality, Trade, Transportation and Utilities and Other Services led the way followed by Educational and Health Services. This comes at a good time. Based on the initial unemployment claims data for May, it appears that the ripple effect of previous months layoffs are now spreading to industries that were less effected at first. The large employment gains the state experienced in May could help stem that spreading of employment losses in other sectors.
- Greater Phoenix had the largest gains in the state. The area added 30,400 jobs in May. That’s a 1.5% growth rate. The Phoenix area is still 111,000 jobs below a year ago. Great Tucson added 7,500 jobs or a 2.1% growth rate. The seasonally adjusted growth rate for the State was up 2.4%, Greater Phoenix 2.1% and Greater Tucson 2.5%.
- The state is doing very well in relative terms as well. The state’s employment performance is now second out of fifty states year to date. Only Utah has done better this year.
- Greater Phoenix is the fastest growing (lost the fewest jobs as a percent of total) of any major employment market in the country (year-to-date).
About EDPCo
Elliott D. Pollack & Company (EDPCo) offers a broad range of economic and real estate consulting services backed by one of the most comprehensive databases found in the nation. This information makes it possible for the firm to conduct economic forecasting, develop economic impact studies and prepare demographic analyses and forecasts. Econometric modeling and economic development analysis and planning are also part of our capabilities. EDPCo staff includes professionals with backgrounds in economics, urban planning, financial analysis, real estate development and government. These professionals serve a broad client base of both public and private sector entities that range from school districts and utility companies to law firms and real estate developers.
For more information, contact –
Elliott D. Pollack & Company
5111 N. Scottsdale Rd, Suite 202,
Scottsdale, AZ 85250
480-423-9200 Website | Twitter | Facebook