FOR IMMEDIATE RELEASE
August 17, 2020
The Monday Morning Quarterback
A quick analysis of important economic data released over the last week
This will be a week of random thoughts, but they tie together.
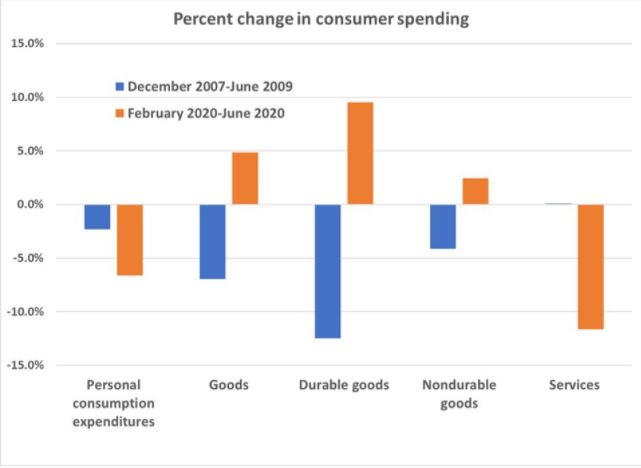
It starts with retail sales. Retail sales continued to rise in July. Even though they came in slightly below expectations, they were up 1.2% over a very strong June number. But, the amazing thing is that in the face of the largest drop in economic activity in over 80 years, (a drop in real GDP of 11% in the first half of the year) retail sales were up 2.7% over a year ago and 1.7% above February. Wow!! But what is even more unusual is the mix of items that are selling. Consumers spent their money on goods rather than services. This is unheard of during a recession. Spending on goods was up 5% since February while services spending was down almost 12% over the same period.
How can this be? There are several reasons.
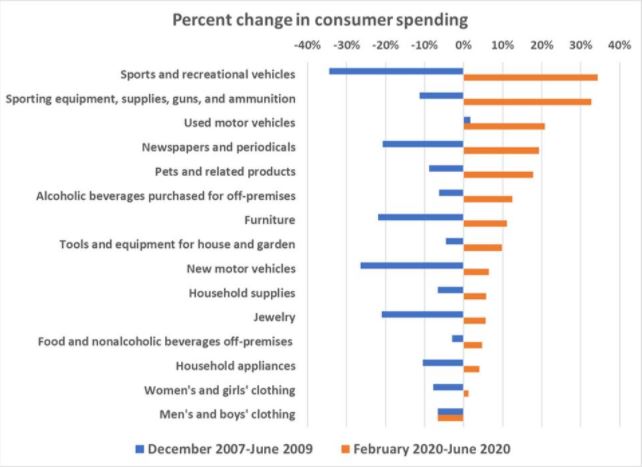
First, choices were limited. Much of the economy was shut down during March and April, then opened again in May and June only to, in part, shut down again. Lack of spending at restaurants, bars, hotels, airlines, sporting events, concerts and the like caused a big part of the shift (see charts below). Second, the CARES Act. Despite record job losses and the resultant loss in pay, government transfer payments caused personal income to grow at a rapid rate between March and the end of July. Then, unfortunately, in early August, Congress walked away from its responsibilities to those who were unemployed, not due to a typical recession, but, because the economy was shut down by government. That’s when Congress adjourned and went home. Third, given the lockdown in most states in March and April and the continued closure of many retail and service businesses, there was lots of pent up demand.
So, exactly where was money spent? It was on items that usually suffer during recessions. Sports and recreational vehicles, sporting equipment, pets and pet products, alcoholic beverages, autos and even jewelry. Services, especially leisure related services and postponed elective medical services, hit the wall. This explains the increase in the manufacturing sector as of late. This pattern would normally be expected to continue until COVID-19 is resolved in some form. But, maybe not.
I’ve talked about the need for the government to keep those who are unemployed due to COVID-19 and the resultant shutdowns solvent. It can be done by paying them an amount that equates to about 75%-80% of their total salary with a cap (certainly not the amount that created the perverse incentives in the CARES Act). That would about equate to their lost take home pay. And it would allow them to come out on the other side of this and still be financially solvent. In the absence of financial support, it could be a mess and potentially take years to clean up. No, I have not turned into a socialist. This is not a typical recession. It is right out of a science fiction book. There would not have been a recession in 2020 or 2021 or maybe not even 2022 were it not for the forced shutdown that seemed like an imperative in March. This is important because it is in all our interests to keep the transition in and out the current situation as painless as possible. Otherwise, watch out!!
Did we need to spend $3.5 trillion (that’s on top of the $14.3 trillion we owed as of the first quarter) in the March-July period to only then let the roof collapse in August? Of course not. But that’s where all the jokes about politicians and pork come from (much based in truth). Fortunately, the Executive Orders from a week ago last Friday will help. Will it be enough? Time will tell. Real quickly, this level of federal debt will have consequences. Were it financed over 50 years at 175 basis points, the day of reckoning would be pushed way down the road. But, that hasn’t happened. Can you imagine what happens when interest rates finally do go up? That will push much of other spending out of the picture. For those of you who believe that government debt won’t have eventual consequences, please read “This Time is Different” by Reinhart and Rogoff.
But, that’s not the debt I want to focus on right now. I want to talk about consumer debt. It’s shrinking rapidly. Credit card debt fell by $76 billion. Given the inability to spend as much as normal (think closed restaurants, no vacations or sporting events, no bars and fewer retail stores) combined with stimulus from the CARES Act and other programs from the government, all of this should not be a surprise. Again, this is not a normal recession. It also suggests that other things being equal, once the pandemic has passed, there should be pent up demand and the ability to buy.
But other things are not equal. Not by a long shot. Those who remained employed will have lots of cash. Those that lost their jobs won’t be as lucky. To give an example, many of you have probably taken your kids to a bowling alley at some point in their childhood. In order to make it more exciting than throwing gutter balls on every shot, you could get them to put in gutter rails so that the ball would bounce off the rails and eventually hit some pins. The kids loved it, even though it wasn’t reality.
Well, the New York Fed reports on foreclosures and bankruptcies. According to Rodney Johnson of H.S. Dent, in the second quarter, “foreclosures were down 60% and bankruptcy notations on personal credit reports were down more than 40% from the same period last year.” How can that be possible given current conditions?
You guessed it. Governments and banks at all levels are participating in a shell game. Be it moratoriums on evictions and missed rent payments, forbearances on mortgages, credit card debt, car loans, student debt payments or just the closure of many courts due to COVID-19, the flow of normal business clearing activities has not been allowed to proceed. It was just kicked down the road.
With mortgages, it can be added on to the end of mortgage. But, for other debt, much of the postponed payments will just accumulate at some level. What will happen when some or all of it has to be paid? Lenders and borrowers can act as if when the ball bounces off the gutter rails at the bowling alley and the ball hits the pins, that all is well. But, in reality, it’s not. As, Johnson points out “…until we deal with the debt-clearing phase, we can’t move on.”
This, again, pushes to the forefront the issue of a “have and have not” economy that we have been discussing since March. It will be a problem at the other end of this. Some will go out and spend. Others will face an ugly reality.
As for last week’s data, weekly initial jobless claims improved but were still well above year earlier levels. The latest Blue Chip consensus forecast suggests the economy will improve as monthly data show sizable improvements as the economy reopens. But the recovery will be slow after an initial burst off the bottom. Job openings data suggests many jobs are still unfilled. Consumer sentiment was about flat. Industrial production increased a little. Consumer prices are still under control. Retail sales, as discussed above, improved. Mortgage applications rose. And housing prices were up.
In Arizona, initial unemployment claims continued to decline. This is a positive sign. Retail sales in the state and in Maricopa County were up for the month and were well above year earlier levels. Resale housing prices continue to increase and are now well above year earlier levels. This is not a great sign. And in Tucson, listings in MLS are way down from a year ago, sales are up, and prices are up as well.
U.S. Snapshot:
- Seasonally adjusted initial claims for unemployment insurance fell 228,000 to 963,000 for the week ending August 8th. This is the second straight week below 1 million. Yet, initial claims filings remain stubbornly high and are still 342% above year earlier levels. With more than 28 million workers still collecting UI benefits, the expiration of the $600 additional weekly benefit at the end of July will begin to take a toll on consumer spending and household financial health. This is not good news.
- The Blue Chip consensus forecast is projecting a 5.2% decline in real GDP in 2020 and a gain of 3.8% in 2021. This can only be described as a tepid recovery. The mixed outlook is being exacerbated by indecision in Washington as congress seems unable to agree on further COVID relief legislation.
- Job openings increased at a rate of 4.1% from 3.9% in May to 5.9 million postings. However, hiring fell below the May pace with 6.7 million hires. That’s down 7.2%. Separations increased as well, from 4.2 million in May to 4.8 million is June. As a result, net hiring declined by 1 million to a level of 1.9 million in June.
- The University of Michigan consumer sentiment index remained largely unchanged in early August from the July reading or the April low. Two significant changes since April have been that consumers have become more pessimistic about the 5-year economic outlook (-18 points) and more optimistic about buying conditions (+21 points). The policy gridlock in Washington has acted to increase uncertainty and heighten the need for precautionary funds to offset lapses in the economic relief programs and hedge against fears about the persistence and spread of the COVID virus.
- For reasons described above, U.S. factory conditions improved over the past few months as states have reopened their economies. Industrial production increased 3.0% in July after a 5.7% gain in June.
- Consumer prices as measured by the consumer price index rose 0.6% in July and now stands 1.0% above a year ago. The index less food and energy known as the base rate of inflation also rose 0.6% in July and is 1.6% above year earlier levels. Deflation pressures are easing but a slowdown and reversal of reopening keep deflation a serious risk.
- As discussed above, retail sales continued to rise in July although the pace continued to slow as the level of sales surpassed its pre-pandemic level. Retail sales increased by 1.2% in July after soaring an upwardly revised 8.4% in June and 18.3% in May. Sales are now 2.7% above a year ago and 1.7% above February levels.
- Mortgage applications rose 6.8% over the week of August 7th after a 5.1% decrease the previous week. Both purchasing and refinance rose.
- According to the NAR, metro area home prices now stand 4.2% above a year ago as of the second quarter of 2020.
- National hotel occupancy levels were up to 49.9% from 48.9% a week earlier. That’s still down 33.3% from a year ago.
- TSA weekly traveler throughput was up to 4,865,794. That’s up 110,000 from a week earlier but down 73.2% from a year ago.
Arizona Snapshot:
- Initial claims for unemployment insurance in the state fell to 12,283 the week of August 8th. That’s down from 15,561 the previous week. It is still 218% above a year ago. But, this is a significant improvement. A month ago, 28,695 people filed initial claims. That was 401% above year earlier levels.
- Retail sales in the state rose 4.0% in June and stood 13.7% above June 2019 levels. In Maricopa County, retails sales for the month were up 5.0% and stood 12.7% above June 2019.
- Home prices in Greater Phoenix rose 1.9% in the second quarter of 2020 and stood 10.2% above year earlier levels. That level of price increase indicates a significant supply/demand imbalance in the area. In Greater Tucson, prices for the quarter rose 1.0% and stood 4.7% above year earlier levels.
- According to the Tucson MLS, total listings fell to 1,301 in July. This is down from 1,507 in June and 2,507 in July 2019. At the same time, closed sales rose to 1,368 compared to 1,316 in June and 1,330 a year ago. As a result, prices in July were up 8.5% from July 2019.
- Seated diners in Metro Phoenix were down 67.2% from a year ago. Mobility to workplaces in Maricopa County were down 37.6% from a year ago. For the previous week, they were down 37.3%. In Pima County, they were down 33.3% compared to 33.1% the previous week.
- Mobility to retail and recreation places were down 25.9% from a year ago in Maricopa County. That’s the same as the previous week. And in Pima County, they were down 25.3% compared to 26.0% the previous week.
*Charts from the Bureau of Economic Analysis; The Conference Board
About EDPCo
Elliott D. Pollack & Company (EDPCo) offers a broad range of economic and real estate consulting services backed by one of the most comprehensive databases found in the nation. This information makes it possible for the firm to conduct economic forecasting, develop economic impact studies and prepare demographic analyses and forecasts. Econometric modeling and economic development analysis and planning are also part of our capabilities. EDPCo staff includes professionals with backgrounds in economics, urban planning, financial analysis, real estate development and government. These professionals serve a broad client base of both public and private sector entities that range from school districts and utility companies to law firms and real estate developers.
For more information, contact -Elliott D. Pollack & Company
5111 N. Scottsdale Rd, Suite 202, Scottsdale, AZ 85250
480-423-9200 Website | Twitter | Facebook