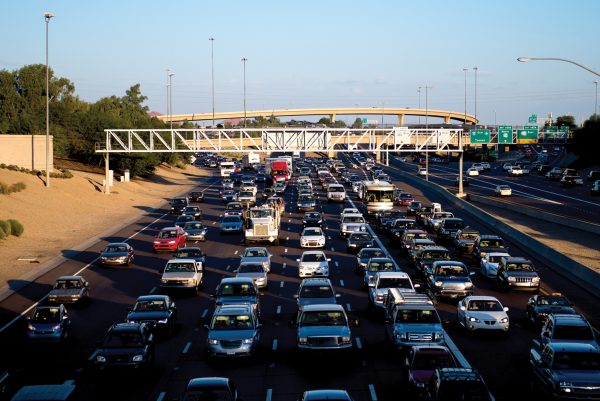
See where the leading “hotspot” in the Valley is
INRIX News Release
(Editor’s note: News releases are published unedited, unless they contain factual errors.)
New York had more traffic hotspots than any other city, costing drivers $64 billion by 2026 due to wasted time, fuel and emissions
Los Angeles, which tops the overall INRIX ranking, has 10 of the 25 worst traffic hotspots in America, costing L.A. drivers an estimated $91 billion over the next 10 years
I-95 in the Washington D.C. region was the worst overall traffic hotspot, which caused 1,384 traffic jams over the study period, stretching 6.47 miles and lasting 33 minutes on average
Research shows initiatives like the Illinois Tollway congestion relief project on I-90 is proving successful at increasing speeds
Kirkland, WA – September 27, 2017 – Today, INRIX published research on the worst traffic hotspots in America. Using INRIX Roadway Analytics, a cloud-based traffic analysis tool, INRIX analyzed and ranked more than 100,000 traffic hotspots in the 25 most congested U.S. cities. The economic cost of hotspots was also calculated in terms of wasted time, lost fuel and carbon emissions over the next decade.
“Many cities are calling for increased transportation infrastructure spending to fix ailing roads, bridges and transit networks,” said Bob Pishue, Senior Economist, INRIX. “By identifying traffic hotspots and analyzing their root causes, cities can effectively combat congestion and maximize present and future investments.”
Ranking America’s Most Congested Cities
INRIX Roadway Analytics identified and ranked 108,000 traffic hotspots in the 25 most congested cities in the U.S identified by the INRIX Global Traffic Scorecard. The ranking was determined by an “Impact Factor,” which is based on the duration, length and frequency of traffic jams. The Impact Factor score enabled INRIX Research to estimate the economic costs at the road level and provided a metric to analyze the health of the transportation network within each city or metro area.
New York had more traffic hotspots (13,608) than any other city analyzed. However, Los Angeles topped the ranking with the highest overall Impact Factor, due to the severity as well as the high number of hotspots (10,385). This also means L.A. pays the highest price, with congestion at these locations potentially costing drivers $91 billion by 2026, if congestion doesn’t improve.
The impact of L.A. hotspots, and the potential cost to drivers, was 42 percent higher than the second ranked city, New York, and three times higher than Washington D.C. (ranked third). Atlanta and Dallas round out the top five, with Chicago, San Francisco, Houston, Miami and Boston making up the top 10. The economic cost to drivers due to wasted time, fuel and emissions in the 25 cities amounts to $481 billion by 2026. When extrapolated to a national level, traffic hotspots could total almost $2.2 trillion over the next decade.
Table 1: INRIX Roadway Analytics Traffic Hotspot Ranking – U.S. Cities
Rank U.S. City No. of Hotspots Impact Factor 2026 Cost of Congestion Worst Traffic Hotspot
1 Los Angeles, CA 10,385 11,692,591 $90.9bn I-405 N at Exit 43 to Exit 21
2 New York, NY 13,608 8,215,036 $63.9bn Brooklyn Queens Expy E at Exit 28A to W Shore Expy
3 Washington D.C. 6,097 3,758,733 $29.2bn I-95 S at Exit 133A to Fairfax County Parkway
4 Atlanta, GA 8,554 3,714,123 $28.9bn I-285 S at I-20 to Route 23
5 Dallas, TX 6,720 3,644,525 $28.3bn I-20 W at Exit 451 to Exit 466
6 Chicago, IL 7,719 3,631,591 $28.2bn I-90 W at 81A to Exit 56B
7 San Francisco, CA 2,587 3,458,305 $26.9bn I-80 W at Emeryville to CA-4
8 Houston, TX 4,417 3,058,004 $23.8bn I-45 S Exit 46A to Exit 63
9 Miami, FL 6,596 2,449,631 $19.1bn I-95 N at Exit 12A to US-1
10 Boston, MA 4,158 2,429,229 $18.9bn Massachusetts Tpke E at Boston U Bridge to Oak St
11 Seattle, WA 2,675 1,929,802 $15.0bn I-5 S at Pike St to 128th St/Exit 186
12 Philadelphia, PA 6,232 1,896,048 $14.7bn Mid-County Expy S at E Rose Valley Rd to Pearl Harbor Memorial Bridge
13 San Diego, CA 1,936 1,602,278 $12.5bn I-15 N at Exit I-215 to Gopher Canyon Road
14 Denver, CO 2,258 1,226,504 $9.5bn US-36 W / I-270 at Exit 1 to Smith Rd
15 Phoenix, AZ 3,441 1,220,561 $9.5bn I-10 W at Exit 138 to Exit 151
16 Portland, OR 2,365 1,154,218 $9.0bn US-26 E at I-405 to NW 185th Ave
17 Nashville, TN 2,602 1,081,459 $8.4bn I-24 W at Antioch Pike to Rocky Fork Rd
18 Austin, TX 1,727 1,076,441 $8.4bn I-35 N at Stassney Ln to Exit 223
19 Columbia, MD 2,856 1,046,558 $8.1bn I-695 CCW at Baltimore Nat’l Pike to Providence Rd
20 Detroit, MI 4,284 1,019,345 $7.9bn I-94 W at Inkster Rd to Gratiot Ave
21 Minneapolis, MN 1,903 799,619 $6.2bn I-94 W at State Hwy 128 to 250th St
22 Stamford, CT 777 729,130 $5.7bn I-95 S at Route 136 to Stratford Ave
23 Pittsburgh, PA 2,744 530,395 $4.1bn Lincoln Hwy E at Fort Pitt Tunnel to Settlers Ridge
24 Baton Rouge, LA 1,090 389,416 $3.0bn I-10 E at College Dr to Port Allen Lock
25 Santa Barbara, CA 174 146,996 $1.1bn US-101 N at San Ysidro Rd to La Conchita
City Cost: $481.4bn
U.S. Cost: $2.2tn
Top 25 Traffic Hotspots
INRIX Roadway Analytics identified and ranked the 25 worst hotspots from the cities studied. While L.A.’s traffic hotspots dominated the rankings – five of the top 10 traffic hotspots and 10 of the top 25 – the worst hotspot was on I-95 Southbound in the Washington D.C. region near Fredericksburg, VA. Traffic jams at the I-95 hotspot occurred 1,394 times over the study period, stretched 6.47 miles and lasted 33 minutes on average, with a potential to cost of $2.3 billion by 2026 if congestion here is not reduced.
INRIX evaluated the effectiveness of recent projects around the top 25 hotspots. Chicago’s top hotspot, I-90 westbound at North Newcastle Avenue, is just 4 miles east of a recent roadway expansion project on the Jane Addams Memorial Tollway. Illinois Tollway recently added a lane in each direction, which increased westbound peak hour travel speeds by 64 percent. It also activated “smart” features, such as dynamic travel times, active lane management and “shoulder running” for buses or emergency vehicles.
Other cities around the country are making strides to reduce congestion and improve travel times. Although in the early stages, state and local governments have support to enact long-term transportation programs to ease congestion like Atlanta’s Transform 285/400, Measure M in Los Angeles, New York’s BQE Atlantic to Sands and Connecting Washington in Washington state.
Table 2: INRIX Roadway Analytics Top 25 Traffic Hotspots in the U.S
Rank U.S. City Worst Traffic Hotspot Avg Time (mins) Avg Length (miles) No. of Traffic jams 2026 Cost of Congestion
1 Washington D.C. I-95 S at Exit 133A to Fairfax County Parkway 33 6.47 1,394 $2.3bn
2 Los Angeles, CA I-405 N at Exit 43 to Exit 21 23 5.12 2,032 $1.9bn
3 Los Angeles, CA I-405 S at Exit 22 to Exit 45 24 4.98 1,403 $1.3bn
4 Los Angeles, CA US-101 S at Exit 3B to CA-134/CA-170 355 4.22 108 $1.3bn
5 Chicago, IL I-90 W at 81A to Exit 56B 79 8.55 238 $1.3bn
6 Los Angeles, CA I-405 N at Exit 53 to 38B 40 5.61 680 $1.2bn
7 Washington D.C. I-95 N at Exit 143B to SR-608 33 4.51 936 $1.1bn
8 Los Angeles, CA US-101 S at Exit 13B to Exit 34 124 4.54 241 $1.1bn
9 Washington D.C. I-495 Beltway at Route 201 to Exit 4A 39 5.08 684 $1.1bn
10 San Diego, CA I-15 N at Exit I-215 to Gopher Canyon Road 177 13.71 54 $1.0bn
11 New York, NY Brooklyn Queens Expy E at Exit 28A to W Shore Expy 64 4.37 462 $1.0bn
12 Houston, TX I-45 S Exit 46A to Exit 63 75 5 340 $992m
13 New York, NY I-95 N / Cross Bronx Expy at Exit 4A to Route 46 155 3.35 243 $981m
14 San Francisco, CA I-80 W at Emeryville to CA-4 53 4.35 504 $904m
15 Los Angeles, CA I-5 S at I-10 to CA-170 76 7.41 201 $880m
16 Atlanta, GA I-285 S at I-20 to Route 23 74 10.38 143 $854m
17 Atlanta, GA I-75 N at Exit 271 to I-75/I-85 62 8.99 187 $811m
18 New York, NY Belt Pkwy E at Crossbay Blvd to I-278 115 7.16 122 $781m
19 Los Angeles, CA I-10 E at I-5/I-10 Exit 135C to Exit 1A Santa Monica 26 9.04 422 $771m
20 Seattle, WA I-5 S at Pike St to 128th St/Exit 186 39 6.14 406 $756m
21 Los Angeles, CA I-5 N Exit 146A to Exit 126B 86 6.13 184 $754m
22 Chicago, IL I-90 E at Exit 50B to I-294 48 6.56 304 $744m
23 Los Angeles, CA I-10 W at I-110 to Exit 19C 112 3.79 218 $720m
24 Los Angeles, CA I-405 N at Exit 70 to I-105 22 12.03 349 $718m
25 New York, NY I-95 S / Cross Bronx Expy at Alexander Hamilton Bdg to Exit 6A 155 3.76 158 $716m
To download the full research report, please visit: http://www2.inrix.com/us-traffic-hotspot-study-2017


