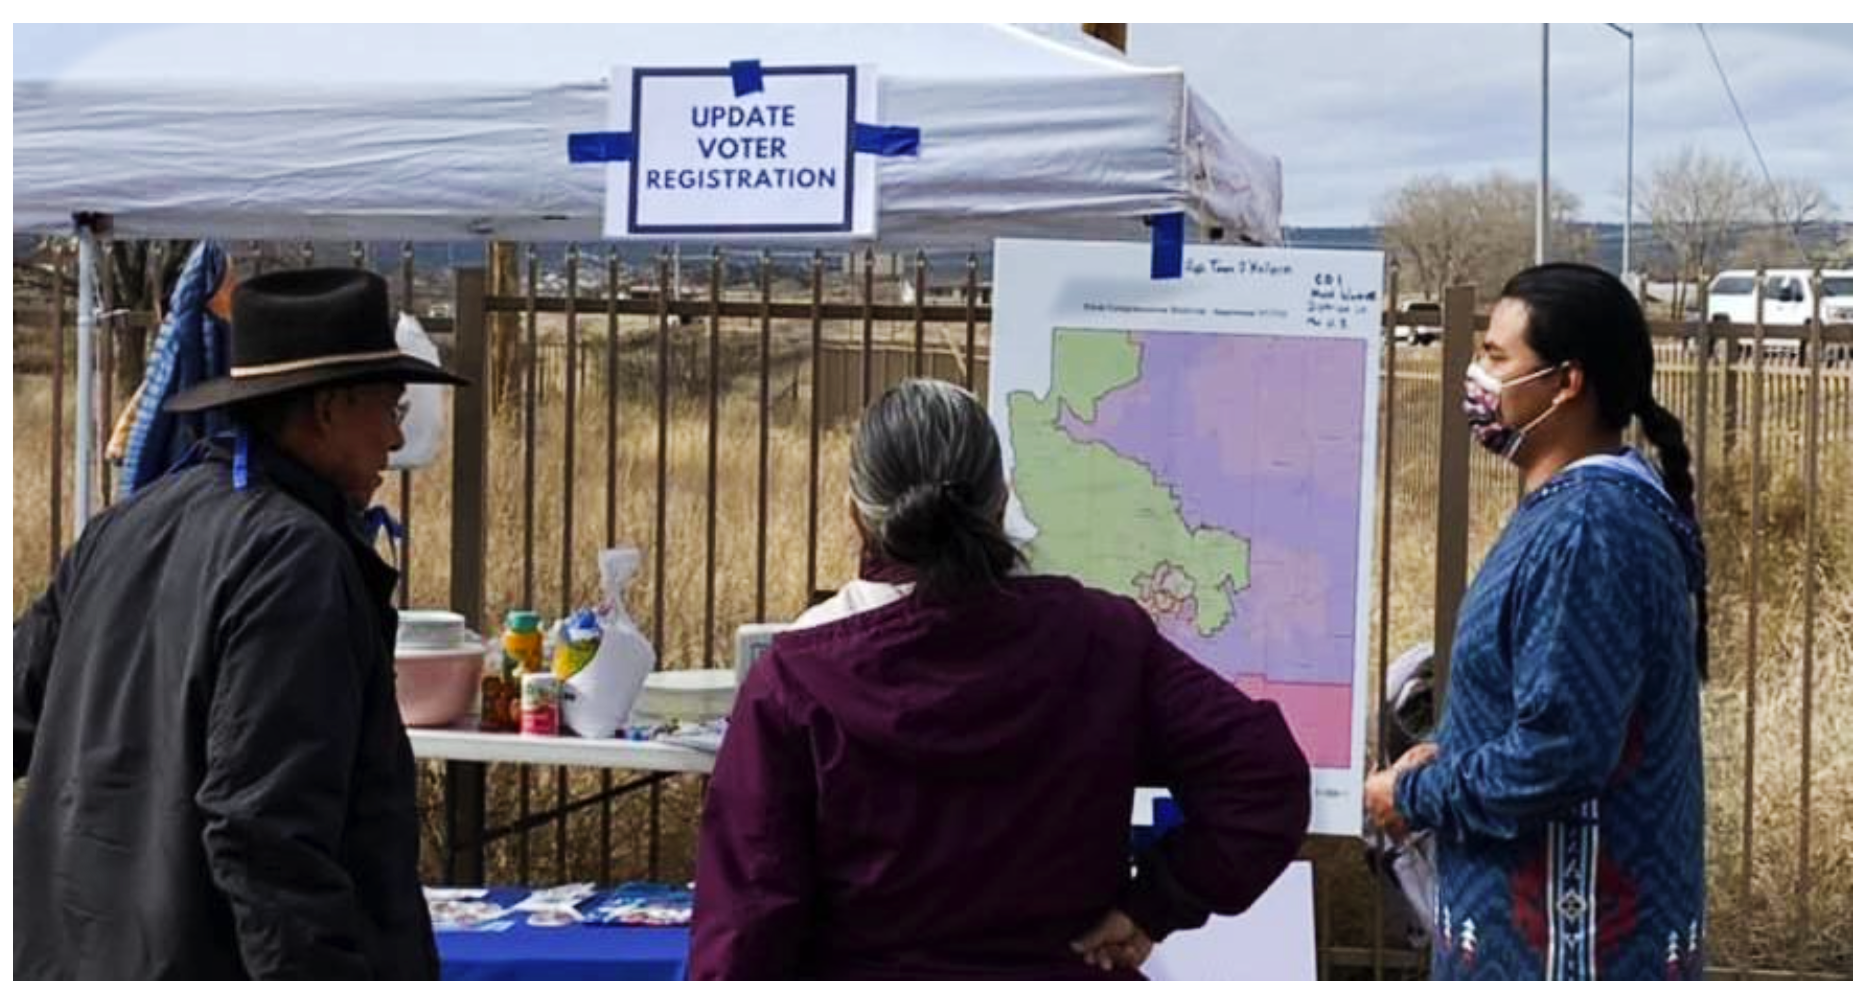
Volunteers with Northeast Arizona Native Democrats talk with potential Native voters in Window Rock, Arizona, about the congressional and legislative map redistricting. || Photo courtesy Northeast Arizona Native Democrats
BY: SHONDIIN SILVERSMITH || Arizona Mirror
Arizona’s newly drawn congressional and legislative maps are officially in use this election cycle and are still a cause of concern for advocates because they could dilute the voting power of Indigenous people in the 2022 midterm election.
“The map doesn’t reflect the reality of what voters want,” said Navajo County Democrats Board Chair Missa Foy. “The map skews things to the right for the state and makes some races a lot tighter than they previously were.”
The Arizona Independent Redistricting Commission’s maps for the state’s 30 legislative districts and nine congressional districts — which will be used for the next decade — weaken the influence that Native American voters will have on who gets elected.
This story is part of a project called Democracy Day, in which newsrooms across the country are shining a light on threats to democracy.
The map causing the most concern among voting advocates and tribal leaders is Congressional District 2, which largely consists of what was known as District 1 in the prior decade.
It’s a great concern among Native voters that they will not get a fair chance of electing who they want to be in office, Foy said. The landmass of the district itself is huge, and most tribal communities are in rural areas.
RELATED: Groups aim to mobilize Asian American voters in Arizona this midterm
Foy is not Native, but she’s worked with the Navajo County Democrats alongside Native voting advocates in the region long enough to understand how the Native vote is impacted in their county. The Navajo County Democrats is a committee that provides education and resources to the public about Democratic positions and ideals.
The Navajo County Democrats developed education tools through their project Northeast Arizona Native Democrats to teach Native voters about the redistricting process and its impact on tribal communities.
This was in response to the lack of public education provided by the AIRC and the state of Arizona about the importance of redistricting. They were among the few Native-led projects to provide redistricting information to Native voters.
Foy said that it’s proven from the work of the district’s current Congressman, Rep. Tom O’Halleran, how important it is to have someone who understands tribal communities in office.
He’s been able to bring funds back into the district and make sure some of that money goes into tribal lands, she said.
“The land mass of CD2 is huge,” Foy said, adding that it makes up about 60% of Arizona’s land mass. Tribal land makes up a large part of that district.
The Congressional District 2 map now includes 14 tribes in northern, eastern, and central Arizona, and those tribal members make up about 20% of the district’s population.
The total population within District 2 is more than 794,000 people, with over 628,000 of voting age, according to data from the AIRC. The district voting splits with 46% going toward Democratic candidates and 53% going to Republicans.
Foy said voting in District 2 has now shifted by seven points to the right, and District 2 is the most Native district. This shift leaves Native voters at a disadvantage.
Even though District 2 includes more tribal communities, the new map consists of heavily GOP Yavapai County and not just the deeply blue communities in the Verde Valley like the previous map did.
This boundary was the district’s most significant concern for many tribal leaders, who shared their worries with the AIRC.
The Navajo Nation Human Rights Commission even submitted a proposal to the AIRC that would remove most of Yavapai County and half of Gila County from District 2, which would keep the voice of Native voters intact.
The Navajo Nation Human Rights Commission’s proposal garnered support from the Hopi Nation, White Mountain Apache Tribe, San Carlos Apache Tribe, Havasupai Tribeand Paiute tribal leaders.
The Gila River Indian Community made similar recommendations. Gov. Stephen Roe Lewis proposed that the district adjust to omit parts of Yavapai County around Prescott and San Tan Valley in Pinal County while adding Casa Grande, Coolidge, and the southern portions of Graham and Greenlee counties.
In the end, the AIRC acknowledged the Tribes and voting advocates’ concerns, but it did not change the boundaries for District 2.
During the certification meeting for Arizona’s redistricting maps in January, AIRC Democratic Commissioner Shereen Lerner indicated that Republicans outnumber Democrats in voter registration but said Arizona is split roughly evenly between the two parties and independents.
For that reason, she said, she wanted as many competitive districts as possible.
The final map has 13 Republican districts, 12 Democratic ones and five that would be considered competitive under the metrics used by the AIRC. Four of those five competitive districts lean toward the GOP.
The Arizona Independent Redistricting Commission officially certified the maps at the beginning of the year. Arizona’s Secretary of State distributed them to County Recorders to update their voting materials for this year’s election.
Regarding the legislative district maps, advocates and tribal leaders voiced some concerns over a few proposed districts, but overall they were satisfied.
The ARIC is required to draw a Native American majority-minority legislative district because of the Voting Rights Act, but they’re not required by law to do that for the congressional districts.
Foy said Legislative District 6 has an Indigenous population of about 61%, allowing Indigenous voters to choose a candidate for the state legislature.
“What they did was they gave Indigenous voters that district while really taking their congressional representation,” Foy said of the AIRC’s decision for the District 6 map.
One of the biggest concerns surrounding the legislative maps was how District 6 placed the City of Flagstaff and tribal communities in the same district. Tribal leaders and voting advocates noted it tilts the political power away from Indigenous voters.
Patty Ferguson-Bohnee, director of Arizona State University’s Indian Legal Clinic, said in an interview with The Arizona Mirror last year that concern is not just speculation.
Ferguson-Bohnee noted that the legislative map used from 2001 to 2011 also put Flagstaff and the tribal lands in the same district. The Native American candidates were the preferred candidates for Native voters, but they lost in the primary election to non-Native candidates who Flagstaff voters favored.
“That trumped the Native American preferences,” she said. That history should be an indicator that drawing a similar district will diminish the ability of Indigenous communities to be able to elect their chosen candidates.
The concern resonated with AIRC Chairwoman Erika Neuberg, who said at a commission meeting in December that she was willing to consider changing the map to remove Flagstaff from the predominantly tribal District 6.
During the final days of the map’s approval, the AIRC agreed to change the boundaries of the District 6 map. The ARIC moved more of the city of Flagstaff, along with Snowflake and Show Low, into District 7 and moved Eagar and St. Johns, and Springerville into District 6.
In the end, the final legislative maps that the ARIC approved showed that Republicans hold an edge. Still, it has enough competitive districts that Democrats could have a chance to take control of one or both legislative chambers.