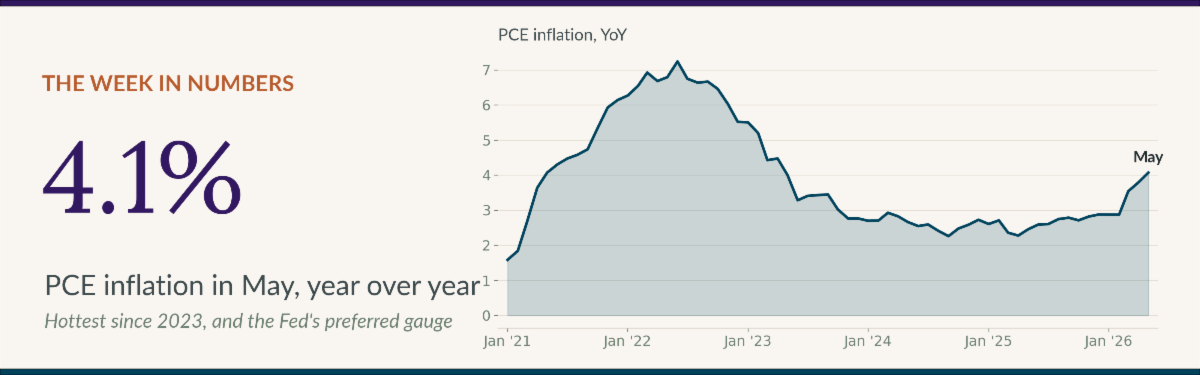
The Fed’s preferred inflation gauge hit a three-year high in May, but consumers kept spending, validating last week’s decision to hold rates.
| 4.1% ▲PCE inflation, May (YoY) | 3.4% ▲Core PCE, May (YoY) | +0.7% ▲Consumer spending, May | 580K ▼New home sales, May (SAAR) |
The Fed’s preferred inflation gauge is heading the wrong way. The Personal Consumption Expenditures (PCE) price index rose 4.1% in May from a year earlier, up from 3.8% in April and 3.5% in March. That is the fastest pace since early 2023, and it is the third straight month the number has climbed. Core PCE, which strips out volatile food and energy and is the figure the Fed watches most closely, rose to 3.4%. Neither is anywhere close to the Fed’s 2% target. A week after the Fed told us it was in no hurry to cut rates, the May data explained why.
A word on what this gauge is, because the Fed leans on it for a reason. The PCE price index is the Commerce Department’s measure of what Americans actually pay for goods and services, and it differs from the better-known Consumer Price Index in how it weights spending and in how it accounts for people trading down to cheaper substitutes when prices rise. The Fed prefers it precisely because it captures that behavior. On the month, prices rose 0.4%, with core up 0.3%, the same monthly clip as April. So this is not one noisy reading. The trend has turned higher, and it has done so while the Fed is trying to push inflation down.
Here is the complication. The same report showed that the American consumer has not gotten the memo. Personal income rose 0.7% in May and personal spending rose 0.7% as well, both stronger than forecasters expected. Even after accounting for higher prices, real spending was up 0.3%. To pay for it, households dipped into savings, and the saving rate slipped to 3.0%, a low reading by the standards of the past several years. When consumers keep spending into rising prices, they hand businesses the room to keep raising them. That is the engine the Fed is trying to slow, and in May it was still running.
And the growth picture has improved. The government’s third estimate of first-quarter GDP was revised up to a 2.1% annual rate, half a point higher than the prior estimate, on stronger net trade. The economy grew just 0.5% in the final quarter of 2025, so the first quarter marks a reacceleration, not a stall. That is not the profile of an economy that needs cheaper money to keep its head above water.
The cost of higher-for-longer is showing up where it always shows up first, in housing. New single-family home sales fell 7.3% in May to a 580,000 annual rate, down from 626,000 in April and below the 622,000 of a year ago. Builders are now sitting on a 10.3-month supply of unsold homes, well above what a balanced market looks like, with the 30-year mortgage stuck at 6.49%.
With inflation reaccelerating and the consumer still spending, the case for a rate cut this summer is thin, and the case for the patience the Fed signaled last week is strong. The next real test comes quickly. The June jobs report lands Thursday, July 2. If hiring holds up alongside this inflation reading, the Fed has every reason to keep waiting.
U.S. Snapshot
PCE rose 0.4% in May and 4.1% from a year ago, while core PCE rose 0.3% and 3.4%. Both annual rates are the highest since 2023 and have now risen for three consecutive months.
Personal income and personal spending each rose 0.7% in May, both above expectations. Real (inflation-adjusted) spending was up 0.3%, and the personal saving rate eased to 3.0%.
The third estimate of first-quarter GDP was revised up to a 2.1% annual rate from 1.6%, mostly on firmer net trade. Corporate profits rose $74.4 billion.
Business activity picked up in June. S&P Global’s flash U.S. composite PMI rose to 52.2 from 51.5 in May, a five-month high, led by a jump in the manufacturing gauge to 55.7, roughly a four-year high, while services edged up to 51.3. Any reading above 50 signals expansion.
New orders for durable goods fell 4.5% in May after an 8.5% jump in April, almost entirely on a swing in aircraft orders. Excluding transportation, orders rose, and core capital-goods orders, a proxy for business investment, were up 1.6%.
Sales of new single-family homes fell 7.3% to a 580,000 annual rate in May, down from 626,000 in April and 622,000 a year ago. The supply of new homes for sale climbed to 10.3 months.
Consumer sentiment improved but stayed near historic lows. The University of Michigan’s final June index rose to 49.5 from May’s record low of 44.8, helped by lower gasoline prices, though it remained well below the 60.7 of a year ago and short of the 50.0 economists expected.
Initial jobless claims fell to 215,000 in the week ending June 20, down 12,000 from the prior week, and the four-week average held at 224,250. Continuing claims edged up to 1.82 million. Layoffs remain low.
The 30-year fixed mortgage rate averaged 6.49%, little changed on the week and down from 6.77% a year ago.
Arizona Snapshot
Light week for Arizona data.
The next read on local home prices arrives next week, when the S&P CoreLogic Case-Shiller index for April is released on June 30. Greater Phoenix has been among the softer big metros for price growth, and we will see whether that held.