Infographic: Forget Red And Blue. The Most Accurate Map Of U.S. Voters Is Purple

It never quite makes sense, watching the election play out. You see huge areas of red on a map–whole states and counties–while commentators quickly explain that populations aren’t accurately represented. It’s good information, but when we’re discussing real voting patterns, why are we looking at such maps in the first place?

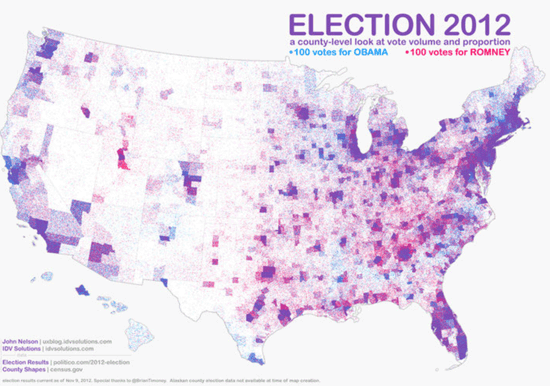
John Nelson from IDV Solutions created a different map of 2012’s presidential election results with data pulled from Politico. Rather than color in whole blocs of the map based on the party of its voting majority, every 100 votes is represented by a dot, randomly dispersed within the county they were cast. So instead of red and blue blocs, we see something much closer to real people voting, and where.

Check it out 

Share this!

Additional Articles

News Categories

Get Our Twice Weekly Newsletter!

* indicates required

Rose Law Group pc values “outrageous client service.” We pride ourselves on hyper-responsiveness to our clients’ needs and an extraordinary record of success in achieving our clients’ goals. We know we get results and our list of outstanding clients speaks to the quality of our work.

PRTA suspends operations

(Disclosure: Rose Law Group represents a coalition of property and business owners throughout Pinal County who have worked to bring new transportation infrastructure to the

Read More »
November 2012
M T W T F S S
 1234
567891011
12131415161718
19202122232425
2627282930