 ELLIOTT D. POLLACK ELLIOTT D. POLLACK
FOR IMMEDIATE RELEASE
November 21st, 2016
The Monday Morning Quarterback
A quick analysis of important economic data released over the last week
Happy Thanksgiving!
This week’s news shows that there is a lot to be thankful for. The economy continues to improve. As it does, the excess supply of labor continues to be incrementally absorbed. If President-elect Trump’s economic program passes congress, we will find out exactly what the unemployment figures really mean. These figures are based on those who say they are looking for a job. Given that the labor force participation rate has declined back to levels not seen for 30 years, an uptick in economic activity 90+ months into a recovery/expansion, even a tepid recovery/expansion such as the one we are experiencing, will test labor markets. A great deal has to happen between now and then, but, it will make things even more interesting to follow.
Last week’s data shows that labor markets are improving, retail sales going into the Christmas season are respectable, industrial production remains relatively flat, consumer prices are still under control and housing starts are doing well.
Given the pick-up in activity that is probably in front of us, it is a favorable picture.
U.S. Snapshot:
- Initial claims for unemployment insurance continue to decline. The 4-week average is down 7.3% from a year ago. Readings throughout the report are at or near historic lows. This indicates employers are holding tightly to their employees.
- Retail sales for October were up 4.3% from a year ago and 0.8% above September. The largest gains were in nonstore retailers, up 12.9% from a year ago.
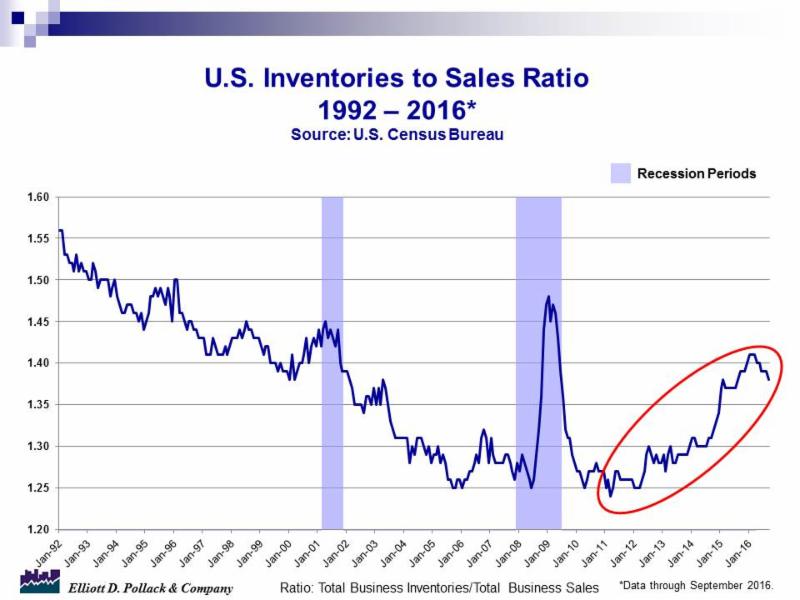
- Manufacturing and trade sales were up 0.7% for the month in September and were up 0.8% from a year ago. Total inventories were up 0.1% and 0.6% respectively. Thus, the inventories to sales ratio declined to 1.38 from 1.39 from last month and a year ago. While the ratio is still high, it is now moving in the right direction (see chart below).
- Industrial production held steady in October after declining 0.2% in September. It now stands 0.9% below a year ago.
- Capacity utilization continues to slowly decline from already low levels. As of October, capacity utilization stood at 75.3, down 1.3% from a year ago and 0.1% from September. The long run average (1972-2015) is 80.
- Consumer prices for all urban consumers (CPI-U) in October were up 0.4% from September and 1.6% above a year ago. All items less food and energy were up 0.1% from September and 2.2% above a year ago. This is close to the FED’S target of 2.0%.
- New residential construction did well in October. The most impressive numbers were in housing. Total housing starts were up 23.3% compared to year earlier levels and were up 25.5% over September. Single family starts were up 21.7% from year earlier levels and 10.7% from September. Total permits were up a more modest 4.6% from a year ago and 0.3% from a month ago. Single family permits were up 5.1% and 2.7% respectively.
Arizona Snapshot:
- Arizona’s seasonally adjusted unemployment rate declined three tenths of a percentage point from 5.5% to 5.2% in October. The U.S. seasonally adjusted unemployment rate declined one-tenth of a percentage point from 5.0% to 4.9% in October. A year ago, the statewide rate was 6.1% and the U.S. rate was 5.0%. Greater Phoenix’s rate now stands at 4.5% and Greater Tucson at 4.8%.
- Arizona gained 28,000 nonfarm jobs in October Employment in the state is up 2.7% for the first 10 months of 2016 compared to the similar 2015 period. The state now ranks 8th out of 50 states in employment growth this year.
- Greater Phoenix has gained 37,800 jobs compared to a year ago. Year-to-date, Greater Phoenix area is up 3.1% and now ranks 7th out of 33 major employment markets in the U.S. Greater Tucson gained 7,000 jobs compared to a year ago and is up 2.9% year-to-date.
- R.L. Brown reported that there were 1,390 new housing permits in Greater Phoenix in October. This compared to 1,254 a year ago. Year-to-date, there have been 15,243 single family permits issued compared to 13,547 last year. This is a gain of 12.5%. R.L. also reports that the median resale price in October was $219,000 compared to $200,000 a year ago. That’s a gain of 9.5%. The median new home price was $317,048 in October compared to $302,792 a year ago. That’s a gain of 4.7%.
- Greater Tucson permitted 231 new homes in October. That’s a gain of 11.6% over a year ago. Year-to-date, the area has permitted 2,268 units, a 23.1% increase over last year’s 1,843 units.
|